

Question
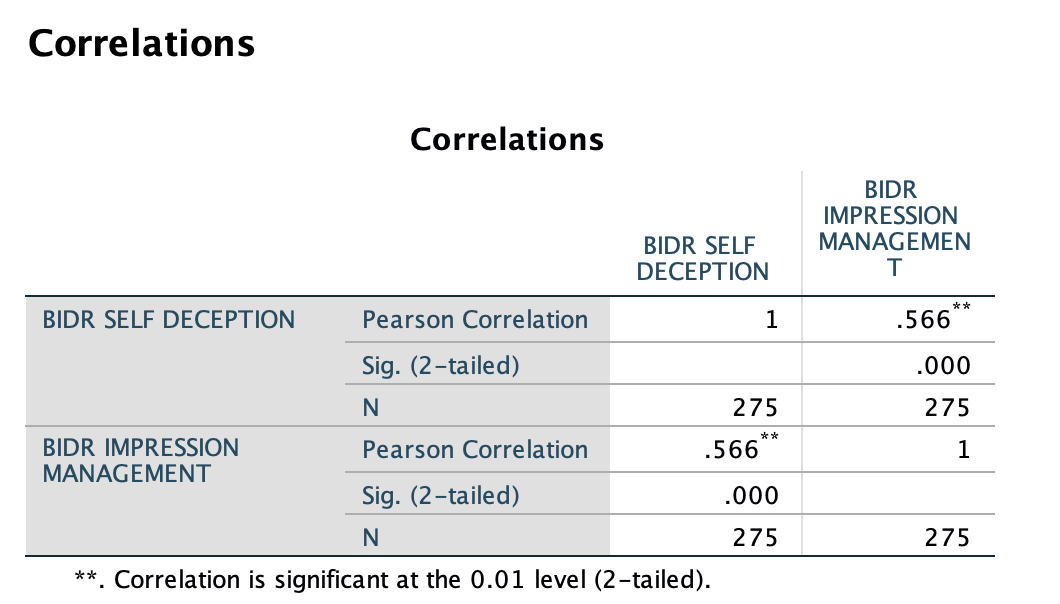
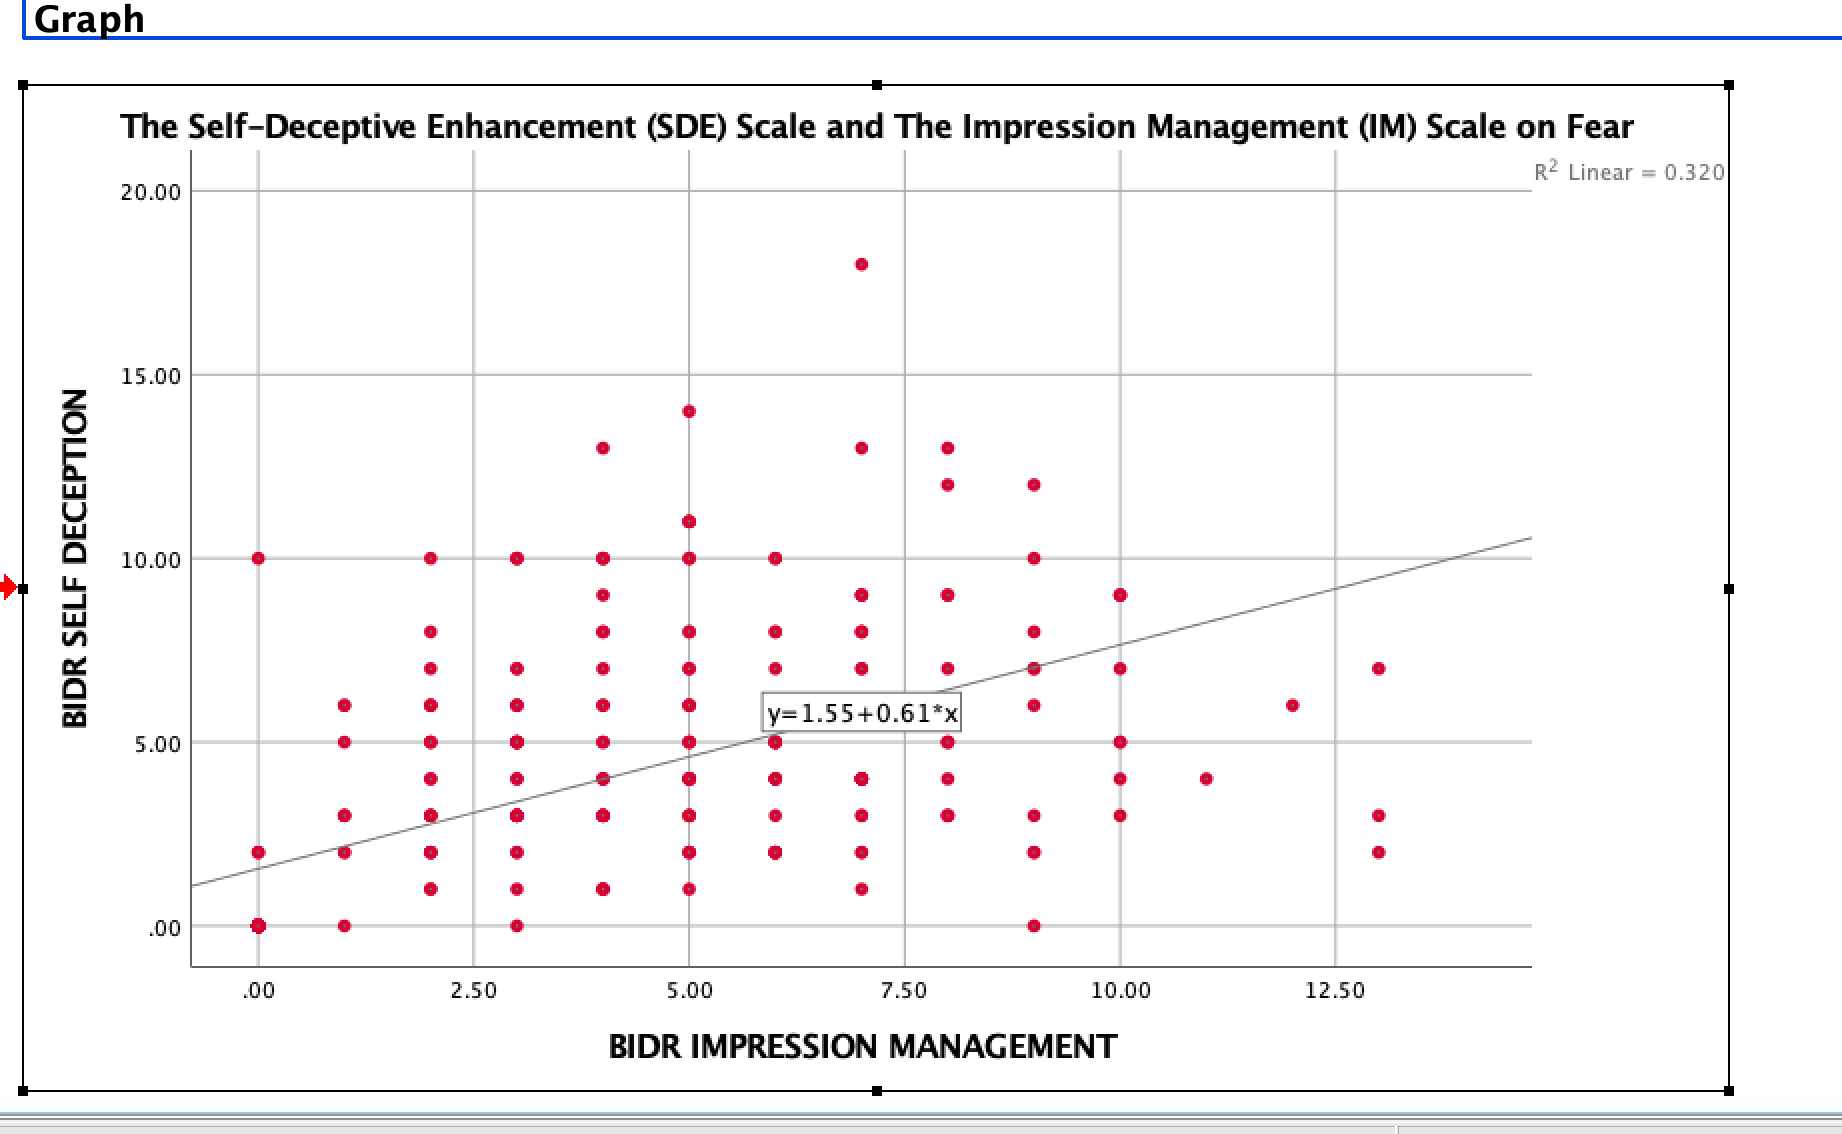
I have to determine if the following information in the table and graph is a positive, negative, or no correlation? The write up assignment has
I have to determine if the following information in the table and graph is a positive, negative, or no correlation? The write up assignment has to consist of ... "Calculation of the Pearson correlation coefficient resulted in a (positive, negative, or NO correlation) between the Self-Deceptive Enhancement (SDE) Scale and the Impression Management (IM) Scale on fear, r = ___?___, p ___?____. The coefficient of determination was r2 =
Step by Step Solution
There are 3 Steps involved in it
Step: 1

Get Instant Access to Expert-Tailored Solutions
See step-by-step solutions with expert insights and AI powered tools for academic success
Step: 2

Step: 3
Ace Your Homework with AI
Get the answers you need in no time with our AI-driven, step-by-step assistance
Get Started
Calculus I With Integrated Precalculus
Authors: Laura Taalman
1st Edition
1464153027, 9781464153020