

Question: I Just need D) to be done, A)- C) is already done. I Just need D) to be done, A)- C) is already done. PART
I Just need D) to be done, A)- C) is already done.
I Just need D) to be done, A)- C) is already done.
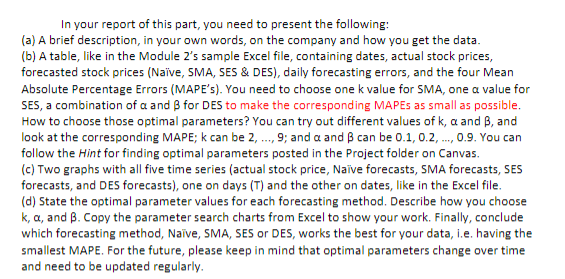
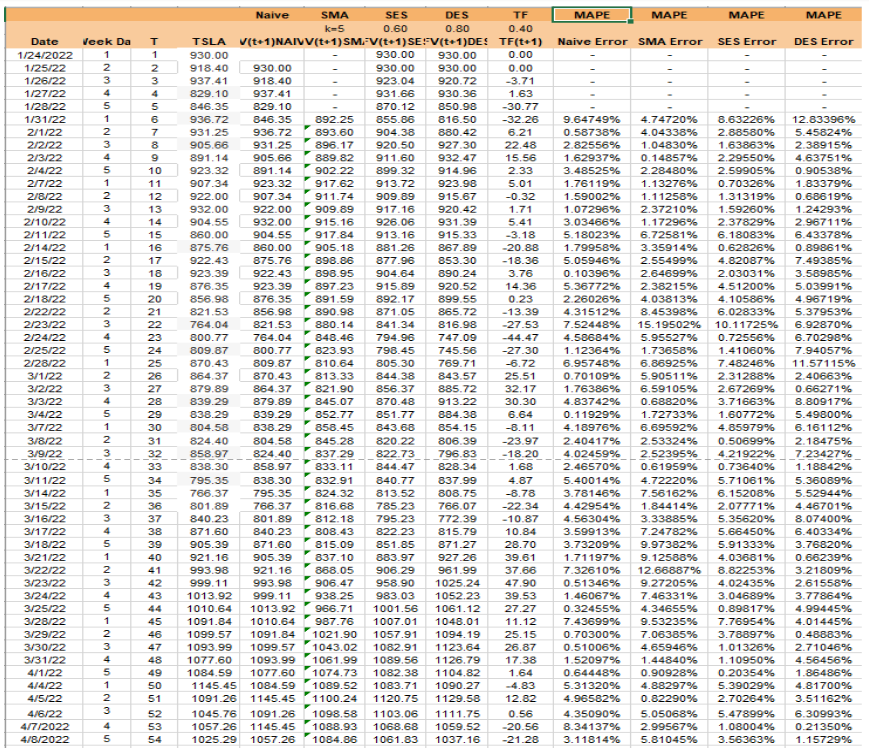
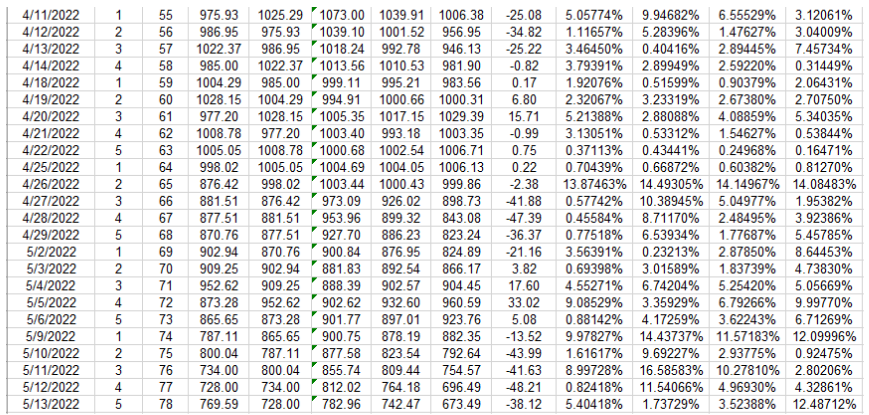
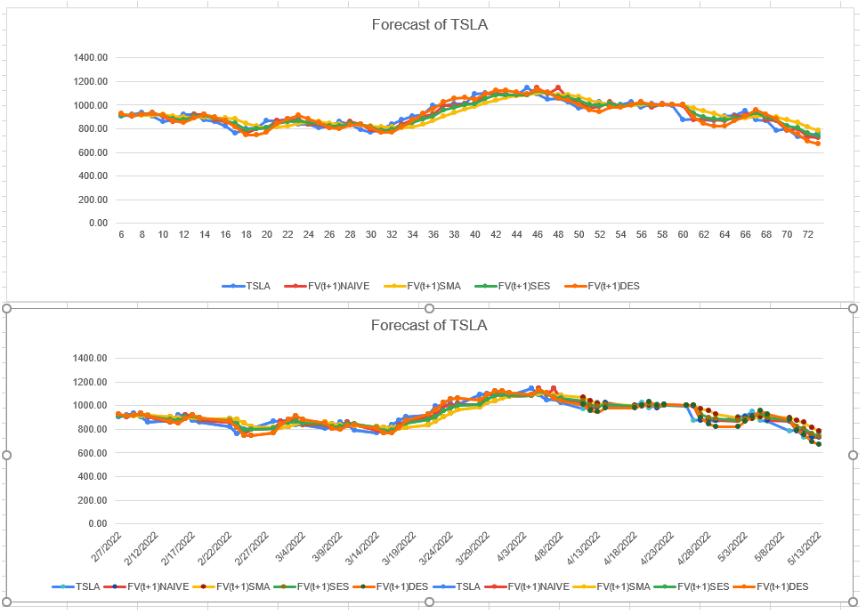
PART 1: FORECASTING In this part, you practice with the simplest forecasting models: Nave, Simple Moving Average (SMA), Simple Exponential Smoothing (SES), and Double Exponential Smoothing (DES), which are introduced in the slides of Module 02. Specifically, each group would select a company whose stock is traded on the New York Stock Exchange. You can get the daily close stock prices from NYSE.com or finance.yahoo.com (current and historical prices; you can download a file from Yahoo Finance). For the Final Project Report, the full time horizon is: 1/24/22-5/13/22. The Checkpoint has a shorter time window (specified above). Based on the data, you need to forecast the stock price for the next day using four different methods. For your work, you can use the forecasting Excel template and follow a video link posted in Module 02 on Canvas as your guide. Please keep in mind this is just an exercise on some forecasting models, which can be applied to, for example, demand forecasting. In no way does your instructor teach or encourage you to do financial investments. We use stock data because you can get them daily for free. In your report of this part, you need to present the following: (a) A brief description, in your own words, on the company and how you get the data. (b) A table, like in the Module 2's sample Excel file, containing dates, actual stock prices, forecasted stock prices (Nave, SMA, SES & DES), daily forecasting errors, and the four Mean Absolute Percentage Errors (MAPE's). You need to choose onek value for SMA, one a value for SES, a combination of a and 3 for DES to make the corresponding MAPES as small as possible. How to choose those optimal parameters? You can try out different values of k, a and B, and look at the corresponding MAPE; k can be 2, ..., 9; and a and B can be 0.1, 0.2,..., 0.9. You can follow the Hint for finding optimal parameters posted in the Project folder on Canvas. (c) Two graphs with all five time series (actual stock price, Nave forecasts, SMA forecasts, SES forecasts, and DES forecasts), one on days (T) and the other on dates, like in the Excel file. (d) State the optimal parameter values for each forecasting method. Describe how you choose k, a, and B. Copy the parameter search charts from Excel to show your work. Finally, conclude which forecasting method, Nave, SMA, SES or DES, works the best for your data, i.e. having the smallest MAPE. For the future, please keep in mind that optimal parameters change over time and need to be updated regularly. 1/24/2022 1/25/22 1/26/22 1/27/22 1/28/22 1/31/22 2/1/22 2/2/22 2/3/22 2/4/22 2/7/22 2/8/22 2/9/22 2/10/22 2/11/22 2/14/22 2/15/22 2/16/22 2/17/22 2/18/22 2/22/22 2/23/22 2/24/22 2/25/22 2/28/22 3/1/22 3/2/22 3/3/22 3/4/22 3/7/22 3/8/22 3/9/22 3/10/22 3/11/22 3/14/22 3/15/22 3/16/22 3/17/22 3/18/22 3/21/22 3/22/22 3/23/22 3/24/22 3/25/22 3/28/22 3/29/22 3/30/22 3/31/22 4/1/22 4/4/22 4/5/22 4/6/22 4/7/2022 4/8/2022 Date Veek Da T 1 2556NSAWNGAWN 3 4 1 3 4 1 3 4 1 NOT 2 3 4 5 2 34 10 5 1 N 2 3 4 5 1 - N345 2 1 N345- 2 1 2 AWN 3 4 5-7345- 1 2 1 2345 Naive SMA SES TF MAPE MAPE DES 0.80 k=5 0.60 0.40 TSLA V(t+1) NAIVV(t+1)SMV(t+1)SE:V(t+1)DE! TF(t+1) Naive Error SMA Error 930.00 930.00 0.00 930.00 918.40 937.41 930.00 930.00 930.00 0.00 918.40 923.04 920.72 -3.71 829.10 937.41 931.66 930.36 1.63 846.35 829.10 870.12 850.98 -30.77 936.72 846.35 892.25 855.86 936.72 893.60 904.38 931.25 905.66 931.25 923.32 891.14 902.22 907.34 923.32 917.62 932.00 904.55 875.76 922.43 923.39 876.35 856.98 821.53 -13.39 -27.53 764.04 747.09 -44.47 870.43 864.37 838.29 816.50 -32.26 880.42 6.21 896.17 920.50 927.30 22.48 891.14 905.66 889.82 911.60 932.47 15.56 899.32 914.96 2.33 913.72 923.98 5.01 922.00 907.34 911.74 909.89 915.67 -0.32 922.00 909.89 917.16 920.42 1.71 932.00 915.16 926.06 931.39 5.41 860.00 904.55 917.84 913.16 915.33 -3.18 860.00 905.18 881.26 867.89 -20.88 875.76 898.86 877.96 853.30 -18.36 922.43 898.95 904.64 890.24 3.76 923.39 897.23 915.89 920.52 14.36 876.35 891.59 892.17 899.55 0.23 856.98 890.98 871.05 865.72 821.53 880.14 841.34 816.98 800.77 764.04 848.46 794.96 809.87 800.77 823.93 798.45 745.56 -27.30 809.87 810.64 805.30 769.71 -6.72 870.43 813.33 844.38 843.57 25.51 879.89 864.37 821.90 856.37 885.72 32.17 839.29 879.89 845.07 870.48 913.22 30.30 839.29 852.77 851.77 884.38 6.64 838.29 858.45 843.68 854.15 -8.11 804.58 845.28 820.22 806.39 -23.97 858.97 824.40 837.29 822.73 796.83 -18.20 838.30 858.97 833.11 844.47 828.34 1.68 838.30 832.91 840.77 837.99 4.87 766.37 795.35 824.32 813.52 808.75 -8.78 801.89 766.37 816.68 785.23 766.07 -22.34 840.23 801.89 812.18 795.23 772.39 -10.87 871.60 840.23 808.43 822.23 815.79 10.84 871.60 815.09 851.85 871.27 28.70 905.39 837.10 883.97 927.26 39.61 921.16 868.05 906.29 961.99 37.66 993.98 906.47 958.90 1025.24 47.90 938.25 983.03 1052.23 39.53 1010.64 1013.92 966.71 1001.56 1061.12 27.27 1091.84 1010.64 987.76 1007.01 1048.01 11.12 1099.57 1091.84 1021.90 1057.91 1094.19 25.15 1093.99 1099.57 1043.02 1082.91 1123.64 26.87 1077.60 1093.99 1061.99 1089.56 1126.79 17.38 1084.59 1077.60 1074.73 1082.38 1104.82 1.64 1145.45 1084.59 1089.52 1083.71 1090.27 -4.83 1100.24 1120.75 1129.58 12.82 1098.58 1103.06 1111.75 0.56 1088.93 1068.68 1059.52 -20.56 1084.86 1061.83 1037.16 -21.28 804.58 824.40 795.35 905.39 40 921.16 993.98 999.11 1013.92 999.11 1091.26 1145.45 1045.76 1091.26 1057.26 1145.45 1025.29 1057.26 1123456NOUISSFA-28~28~28858832858895************ 7 10 17 20 27 30 37 47 MAPE MAPE SES Error DES Error 9.64749% 4.74720% 8.63226% 12.83396% 0.58738% 4.04338% 2.88580% 5.45824% 1.04830% 1.63863% 2.38915% 2.82556% 1.62937% 0.14857% 2.29550% 4.63751% 2.59905% 0.90538% 0.70326% 1.83379% 6.43378% 0.89861% 8.80917% 3.48525% 2.28480% 1.76119% 1.13276% 1.59002% 1.11258% 1.31319% 0.68619% 1.07296% 2.37210% 1.59260% 1.24293% 3.03466% 1.17296% 2.37829% 2.96711% 5.18023% 6.72581% 6.18083% 1.79958% 3.35914% 0.62826% 5.05946% 2.55499% 4.82087% 7.49385% 0.10396% 2.64699% 2.03031% 3.58985% 5.36772% 2.38215% 4.51200% 5.03991% 2.26026% 4.03813% 4.10586% 4.96719% 4.31512% 8.45398% 6.02833% 5.37953% 7.52448% 15.19502% 10.11725% 6.92870% 4.58684% 5.95527% 0.72556% 6.70298% 1.12364% 1.73658% 1.41060% 7.94057% 6.95748% 6.86925% 7.48246% 11.57115% 0.70109% 5.90511% 2.31288% 2.40663% 1.76386% 6.59105% 2.67269% 0.66271% 4.83742% 0.68820% 3.71663% 0.11929% 1.72733% 1.60772% 5.49800% 4.18976% 6.69592% 4.85979% 6.16112% 2.40417% 2.53324% 0.50699% 2.18475% 4.02459% 2.52395% 4.21922% 7.23427% 2.46570% 0.61959% 0.73640% 1.18842% 5.40014% 4.72220% 5.71061% 5.36089% 3.78146% 7.56162% 4.42954% 1.84414% 4.56304% 3.33885% 5.35620% 8.07400% 3.59913% 7.24782% 5.66450% 6.40334% 3.73209% 9.97382% 5.91333% 3.76820% 1.71197% 9.12588% 4.03681% 0.66239% 7.32610% 12.66887% 8.82253% 3.21809% 0.51346% 9.27205% 4.02435% 2.61558% 1.46067% 7.46331% 3.04689% 3.77864% 0.32455% 4.34655% 0.89817% 4.99445% 7.43699% 9.53235% 7.76954% 4.01445% 0.70300% 7.06385% 3.78897% 0.48883% 0.51006% 4.65946% 1.01326% 2.71046% 1.52097% 1.44840% 1.10950% 4.56456% 0.64448% 0.90928% 0.20354% 1.86486% 5.31320% 4.88297% 5.39029% 4.81700% 4.96582% 0.82290% 2.70264% 3.51162% 4.35090% 5.05068% 5.47899% 6.30993% 8.34137% 2.99567% 1.08004% 0.21350% 3.11814% 5.81045% 3.56363% 1.15729% 6.15208% 5.52944% 2.07771% 4.46701% 50 4/11/2022 4/12/2022 2 56 4/13/2022 57 4/14/2022 58 4/18/2022 1 59 4/25/2022 1 4/26/2022 2 65 4/27/2022 3 66 55 975.93 1025.29 1073.00 1039.91 1006.38 -25.08 5.05774% 9.94682% 6.55529% 3.12061% 986.95 975.93 1039.10 1001.52 956.95 -34.82 1.11657% 5.28396% 1.47627% 3.04009% 1022.37 986.95 1018.24 992.78 946.13 -25.22 3.46450% 0.40416% 2.89445% 7.45734% 985.00 1022.37 1013.56 1010.53 981.90 -0.82 3.79391% 2.89949% 2.59220% 0.31449% 1004.29 985.00 999.11 995.21 983.56 0.17 1.92076% 0.51599% 0.90379% 2.06431% 4/19/2022 2 60 1028.15 1004.29 994.91 1000.66 1000.31 6.80 2.32067% 3.23319% 2.67380% 2.70750% 4/20/2022 3 61 977.20 1028.15 1005.35 1017.15 1029.39 15.71 5.21388% 2.88088% 4.08859% 5.34035% 4/21/2022 4 62 1008.78 977.20 1003.40 993.18 1003.35 -0.99 3.13051% 0.53312% 1.54627% 0.53844% 4/22/2022 5 63 1005.05 1008.78 1000.68 1002.54 1006.71 0.75 0.37113% 0.43441% 0.24968% 0.16471% 64 998.02 1005.05 1004.69 1004.05 1006.13 0.22 0.70439% 0.66872% 0.60382% 0.81270% 876.42 998.02 1003.44 1000.43 999.86 -2.38 13.87463% 14.49305% 14.14967% 14.08483% 881.51 876.42 973.09 926.02 898.73 -41.88 0.57742% 10.38945% 5.04977% 1.95382% 877.51 881.51 953.96 899.32 843.08 -47.39 0.45584% 8.71170% 2.48495% 3.92386% 870.76 877.51 927.70 886.23 823.24 -36.37 0.77518% 6.53934% 1.77687% 5.45785% 902.94 870.76 900.84 876.95 824.89 -21.16 3.56391% 0.23213% 2.87850% 8.64453% 902.94 881.83 892.54 866.17 3.82 0.69398% 3.01589% 1.83739% 4.73830% 909.25 888.39 902.57 904.45 17.60 4.55271% 6.74204% 5.25420% 5.05669% 902.62 932.60 960.59 33.02 9.08529% 3.35929% 6.79266% 9.99770% 901.77 897.01 923.76 5.08 0.88142% 4.17259% 3.62243% 6.71269% 900.75 878.19 882.35 -13.52 9.97827% 14.43737% 11.57183 % 12.09996% 792.64 -43.99 1.61617% 9.69227% 2.93775% 0.92475% 754.57 -41.63 8.99728% 16.58583% 10.27810% 2.80206% 696.49 -48.21 0.82418% 11.54066% 4.96930% 4.32861% 673.49 -38.12 5.40418% 1.73729% 3.52388% 12.48712% 4/28/2022 4 67 4/29/2022 5 68 5/2/2022 1 69 5/3/2022 2 70 909.25 5/4/2022 3 71 952.62 5/5/2022 4 72 873.28 952.62 5/6/2022 5 73 865.65 873.28 5/9/2022 1 74 787.11 865.65 5/10/2022 2 800.04 787.11 877.58 823.54 5/11/2022 3 855.74 809.44 734.00 800.04 728.00 734.00 5/12/2022 812.02 764.18 5/13/2022 769.59 728.00 782.96 742.47 122 3 4 45 5 3 4 75 5 7 78 76 77 Forecast of TSLA 1400.00 1200.00 1000.00 800.00 600.00 400.00 200.00 0.00 6 8 10 12 14 16 18 20 22 24 26 28 30 32 34 36 38 40 42 44 46 48 50 52 54 56 58 60 62 64 66 68 70 72 -TSLA -FV(1+1)NAIVE -FV(t+1)SMA FV(t+1)SES -FV(t+1)DES Forecast of TSLA 1400.00 1200.00 1000.00 800.00 600.00 400.00 200.00 0.00 2/7/2022 -TSLA 2/12/2022 2/17/2022 2/22/2022 2/27/2022 3/9/2022 3/4/2022 3/14/2022 3/19/2022 3/24/2022 4/3/2022 3/29/2022 4/8/2022 FV(+1)NAIVE FV(+1)SMAFV(+1)SESFV(+1)DES-TSLA-FV(+1)NAIVE 4/13/2022 4/18/2022 4/23/2022 4/28/2022 5/3/2022 5/8/2022 5/13/2022 -FV(t+1)SMAFV(+1)SESFV(+1)DES PART 1: FORECASTING In this part, you practice with the simplest forecasting models: Nave, Simple Moving Average (SMA), Simple Exponential Smoothing (SES), and Double Exponential Smoothing (DES), which are introduced in the slides of Module 02. Specifically, each group would select a company whose stock is traded on the New York Stock Exchange. You can get the daily close stock prices from NYSE.com or finance.yahoo.com (current and historical prices; you can download a file from Yahoo Finance). For the Final Project Report, the full time horizon is: 1/24/22-5/13/22. The Checkpoint has a shorter time window (specified above). Based on the data, you need to forecast the stock price for the next day using four different methods. For your work, you can use the forecasting Excel template and follow a video link posted in Module 02 on Canvas as your guide. Please keep in mind this is just an exercise on some forecasting models, which can be applied to, for example, demand forecasting. In no way does your instructor teach or encourage you to do financial investments. We use stock data because you can get them daily for free. In your report of this part, you need to present the following: (a) A brief description, in your own words, on the company and how you get the data. (b) A table, like in the Module 2's sample Excel file, containing dates, actual stock prices, forecasted stock prices (Nave, SMA, SES & DES), daily forecasting errors, and the four Mean Absolute Percentage Errors (MAPE's). You need to choose onek value for SMA, one a value for SES, a combination of a and 3 for DES to make the corresponding MAPES as small as possible. How to choose those optimal parameters? You can try out different values of k, a and B, and look at the corresponding MAPE; k can be 2, ..., 9; and a and B can be 0.1, 0.2,..., 0.9. You can follow the Hint for finding optimal parameters posted in the Project folder on Canvas. (c) Two graphs with all five time series (actual stock price, Nave forecasts, SMA forecasts, SES forecasts, and DES forecasts), one on days (T) and the other on dates, like in the Excel file. (d) State the optimal parameter values for each forecasting method. Describe how you choose k, a, and B. Copy the parameter search charts from Excel to show your work. Finally, conclude which forecasting method, Nave, SMA, SES or DES, works the best for your data, i.e. having the smallest MAPE. For the future, please keep in mind that optimal parameters change over time and need to be updated regularly. 1/24/2022 1/25/22 1/26/22 1/27/22 1/28/22 1/31/22 2/1/22 2/2/22 2/3/22 2/4/22 2/7/22 2/8/22 2/9/22 2/10/22 2/11/22 2/14/22 2/15/22 2/16/22 2/17/22 2/18/22 2/22/22 2/23/22 2/24/22 2/25/22 2/28/22 3/1/22 3/2/22 3/3/22 3/4/22 3/7/22 3/8/22 3/9/22 3/10/22 3/11/22 3/14/22 3/15/22 3/16/22 3/17/22 3/18/22 3/21/22 3/22/22 3/23/22 3/24/22 3/25/22 3/28/22 3/29/22 3/30/22 3/31/22 4/1/22 4/4/22 4/5/22 4/6/22 4/7/2022 4/8/2022 Date Veek Da T 1 2556NSAWNGAWN 3 4 1 3 4 1 3 4 1 NOT 2 3 4 5 2 34 10 5 1 N 2 3 4 5 1 - N345 2 1 N345- 2 1 2 AWN 3 4 5-7345- 1 2 1 2345 Naive SMA SES TF MAPE MAPE DES 0.80 k=5 0.60 0.40 TSLA V(t+1) NAIVV(t+1)SMV(t+1)SE:V(t+1)DE! TF(t+1) Naive Error SMA Error 930.00 930.00 0.00 930.00 918.40 937.41 930.00 930.00 930.00 0.00 918.40 923.04 920.72 -3.71 829.10 937.41 931.66 930.36 1.63 846.35 829.10 870.12 850.98 -30.77 936.72 846.35 892.25 855.86 936.72 893.60 904.38 931.25 905.66 931.25 923.32 891.14 902.22 907.34 923.32 917.62 932.00 904.55 875.76 922.43 923.39 876.35 856.98 821.53 -13.39 -27.53 764.04 747.09 -44.47 870.43 864.37 838.29 816.50 -32.26 880.42 6.21 896.17 920.50 927.30 22.48 891.14 905.66 889.82 911.60 932.47 15.56 899.32 914.96 2.33 913.72 923.98 5.01 922.00 907.34 911.74 909.89 915.67 -0.32 922.00 909.89 917.16 920.42 1.71 932.00 915.16 926.06 931.39 5.41 860.00 904.55 917.84 913.16 915.33 -3.18 860.00 905.18 881.26 867.89 -20.88 875.76 898.86 877.96 853.30 -18.36 922.43 898.95 904.64 890.24 3.76 923.39 897.23 915.89 920.52 14.36 876.35 891.59 892.17 899.55 0.23 856.98 890.98 871.05 865.72 821.53 880.14 841.34 816.98 800.77 764.04 848.46 794.96 809.87 800.77 823.93 798.45 745.56 -27.30 809.87 810.64 805.30 769.71 -6.72 870.43 813.33 844.38 843.57 25.51 879.89 864.37 821.90 856.37 885.72 32.17 839.29 879.89 845.07 870.48 913.22 30.30 839.29 852.77 851.77 884.38 6.64 838.29 858.45 843.68 854.15 -8.11 804.58 845.28 820.22 806.39 -23.97 858.97 824.40 837.29 822.73 796.83 -18.20 838.30 858.97 833.11 844.47 828.34 1.68 838.30 832.91 840.77 837.99 4.87 766.37 795.35 824.32 813.52 808.75 -8.78 801.89 766.37 816.68 785.23 766.07 -22.34 840.23 801.89 812.18 795.23 772.39 -10.87 871.60 840.23 808.43 822.23 815.79 10.84 871.60 815.09 851.85 871.27 28.70 905.39 837.10 883.97 927.26 39.61 921.16 868.05 906.29 961.99 37.66 993.98 906.47 958.90 1025.24 47.90 938.25 983.03 1052.23 39.53 1010.64 1013.92 966.71 1001.56 1061.12 27.27 1091.84 1010.64 987.76 1007.01 1048.01 11.12 1099.57 1091.84 1021.90 1057.91 1094.19 25.15 1093.99 1099.57 1043.02 1082.91 1123.64 26.87 1077.60 1093.99 1061.99 1089.56 1126.79 17.38 1084.59 1077.60 1074.73 1082.38 1104.82 1.64 1145.45 1084.59 1089.52 1083.71 1090.27 -4.83 1100.24 1120.75 1129.58 12.82 1098.58 1103.06 1111.75 0.56 1088.93 1068.68 1059.52 -20.56 1084.86 1061.83 1037.16 -21.28 804.58 824.40 795.35 905.39 40 921.16 993.98 999.11 1013.92 999.11 1091.26 1145.45 1045.76 1091.26 1057.26 1145.45 1025.29 1057.26 1123456NOUISSFA-28~28~28858832858895************ 7 10 17 20 27 30 37 47 MAPE MAPE SES Error DES Error 9.64749% 4.74720% 8.63226% 12.83396% 0.58738% 4.04338% 2.88580% 5.45824% 1.04830% 1.63863% 2.38915% 2.82556% 1.62937% 0.14857% 2.29550% 4.63751% 2.59905% 0.90538% 0.70326% 1.83379% 6.43378% 0.89861% 8.80917% 3.48525% 2.28480% 1.76119% 1.13276% 1.59002% 1.11258% 1.31319% 0.68619% 1.07296% 2.37210% 1.59260% 1.24293% 3.03466% 1.17296% 2.37829% 2.96711% 5.18023% 6.72581% 6.18083% 1.79958% 3.35914% 0.62826% 5.05946% 2.55499% 4.82087% 7.49385% 0.10396% 2.64699% 2.03031% 3.58985% 5.36772% 2.38215% 4.51200% 5.03991% 2.26026% 4.03813% 4.10586% 4.96719% 4.31512% 8.45398% 6.02833% 5.37953% 7.52448% 15.19502% 10.11725% 6.92870% 4.58684% 5.95527% 0.72556% 6.70298% 1.12364% 1.73658% 1.41060% 7.94057% 6.95748% 6.86925% 7.48246% 11.57115% 0.70109% 5.90511% 2.31288% 2.40663% 1.76386% 6.59105% 2.67269% 0.66271% 4.83742% 0.68820% 3.71663% 0.11929% 1.72733% 1.60772% 5.49800% 4.18976% 6.69592% 4.85979% 6.16112% 2.40417% 2.53324% 0.50699% 2.18475% 4.02459% 2.52395% 4.21922% 7.23427% 2.46570% 0.61959% 0.73640% 1.18842% 5.40014% 4.72220% 5.71061% 5.36089% 3.78146% 7.56162% 4.42954% 1.84414% 4.56304% 3.33885% 5.35620% 8.07400% 3.59913% 7.24782% 5.66450% 6.40334% 3.73209% 9.97382% 5.91333% 3.76820% 1.71197% 9.12588% 4.03681% 0.66239% 7.32610% 12.66887% 8.82253% 3.21809% 0.51346% 9.27205% 4.02435% 2.61558% 1.46067% 7.46331% 3.04689% 3.77864% 0.32455% 4.34655% 0.89817% 4.99445% 7.43699% 9.53235% 7.76954% 4.01445% 0.70300% 7.06385% 3.78897% 0.48883% 0.51006% 4.65946% 1.01326% 2.71046% 1.52097% 1.44840% 1.10950% 4.56456% 0.64448% 0.90928% 0.20354% 1.86486% 5.31320% 4.88297% 5.39029% 4.81700% 4.96582% 0.82290% 2.70264% 3.51162% 4.35090% 5.05068% 5.47899% 6.30993% 8.34137% 2.99567% 1.08004% 0.21350% 3.11814% 5.81045% 3.56363% 1.15729% 6.15208% 5.52944% 2.07771% 4.46701% 50 4/11/2022 4/12/2022 2 56 4/13/2022 57 4/14/2022 58 4/18/2022 1 59 4/25/2022 1 4/26/2022 2 65 4/27/2022 3 66 55 975.93 1025.29 1073.00 1039.91 1006.38 -25.08 5.05774% 9.94682% 6.55529% 3.12061% 986.95 975.93 1039.10 1001.52 956.95 -34.82 1.11657% 5.28396% 1.47627% 3.04009% 1022.37 986.95 1018.24 992.78 946.13 -25.22 3.46450% 0.40416% 2.89445% 7.45734% 985.00 1022.37 1013.56 1010.53 981.90 -0.82 3.79391% 2.89949% 2.59220% 0.31449% 1004.29 985.00 999.11 995.21 983.56 0.17 1.92076% 0.51599% 0.90379% 2.06431% 4/19/2022 2 60 1028.15 1004.29 994.91 1000.66 1000.31 6.80 2.32067% 3.23319% 2.67380% 2.70750% 4/20/2022 3 61 977.20 1028.15 1005.35 1017.15 1029.39 15.71 5.21388% 2.88088% 4.08859% 5.34035% 4/21/2022 4 62 1008.78 977.20 1003.40 993.18 1003.35 -0.99 3.13051% 0.53312% 1.54627% 0.53844% 4/22/2022 5 63 1005.05 1008.78 1000.68 1002.54 1006.71 0.75 0.37113% 0.43441% 0.24968% 0.16471% 64 998.02 1005.05 1004.69 1004.05 1006.13 0.22 0.70439% 0.66872% 0.60382% 0.81270% 876.42 998.02 1003.44 1000.43 999.86 -2.38 13.87463% 14.49305% 14.14967% 14.08483% 881.51 876.42 973.09 926.02 898.73 -41.88 0.57742% 10.38945% 5.04977% 1.95382% 877.51 881.51 953.96 899.32 843.08 -47.39 0.45584% 8.71170% 2.48495% 3.92386% 870.76 877.51 927.70 886.23 823.24 -36.37 0.77518% 6.53934% 1.77687% 5.45785% 902.94 870.76 900.84 876.95 824.89 -21.16 3.56391% 0.23213% 2.87850% 8.64453% 902.94 881.83 892.54 866.17 3.82 0.69398% 3.01589% 1.83739% 4.73830% 909.25 888.39 902.57 904.45 17.60 4.55271% 6.74204% 5.25420% 5.05669% 902.62 932.60 960.59 33.02 9.08529% 3.35929% 6.79266% 9.99770% 901.77 897.01 923.76 5.08 0.88142% 4.17259% 3.62243% 6.71269% 900.75 878.19 882.35 -13.52 9.97827% 14.43737% 11.57183 % 12.09996% 792.64 -43.99 1.61617% 9.69227% 2.93775% 0.92475% 754.57 -41.63 8.99728% 16.58583% 10.27810% 2.80206% 696.49 -48.21 0.82418% 11.54066% 4.96930% 4.32861% 673.49 -38.12 5.40418% 1.73729% 3.52388% 12.48712% 4/28/2022 4 67 4/29/2022 5 68 5/2/2022 1 69 5/3/2022 2 70 909.25 5/4/2022 3 71 952.62 5/5/2022 4 72 873.28 952.62 5/6/2022 5 73 865.65 873.28 5/9/2022 1 74 787.11 865.65 5/10/2022 2 800.04 787.11 877.58 823.54 5/11/2022 3 855.74 809.44 734.00 800.04 728.00 734.00 5/12/2022 812.02 764.18 5/13/2022 769.59 728.00 782.96 742.47 122 3 4 45 5 3 4 75 5 7 78 76 77 Forecast of TSLA 1400.00 1200.00 1000.00 800.00 600.00 400.00 200.00 0.00 6 8 10 12 14 16 18 20 22 24 26 28 30 32 34 36 38 40 42 44 46 48 50 52 54 56 58 60 62 64 66 68 70 72 -TSLA -FV(1+1)NAIVE -FV(t+1)SMA FV(t+1)SES -FV(t+1)DES Forecast of TSLA 1400.00 1200.00 1000.00 800.00 600.00 400.00 200.00 0.00 2/7/2022 -TSLA 2/12/2022 2/17/2022 2/22/2022 2/27/2022 3/9/2022 3/4/2022 3/14/2022 3/19/2022 3/24/2022 4/3/2022 3/29/2022 4/8/2022 FV(+1)NAIVE FV(+1)SMAFV(+1)SESFV(+1)DES-TSLA-FV(+1)NAIVE 4/13/2022 4/18/2022 4/23/2022 4/28/2022 5/3/2022 5/8/2022 5/13/2022 -FV(t+1)SMAFV(+1)SESFV(+1)DESStep by Step Solution
There are 3 Steps involved in it
1 Expert Approved Answer
Step: 1 Unlock

Question Has Been Solved by an Expert!
Get step-by-step solutions from verified subject matter experts
Step: 2 Unlock
Step: 3 Unlock