Answered step by step
Verified Expert Solution
Link Copied!

Question

1 Approved Answer

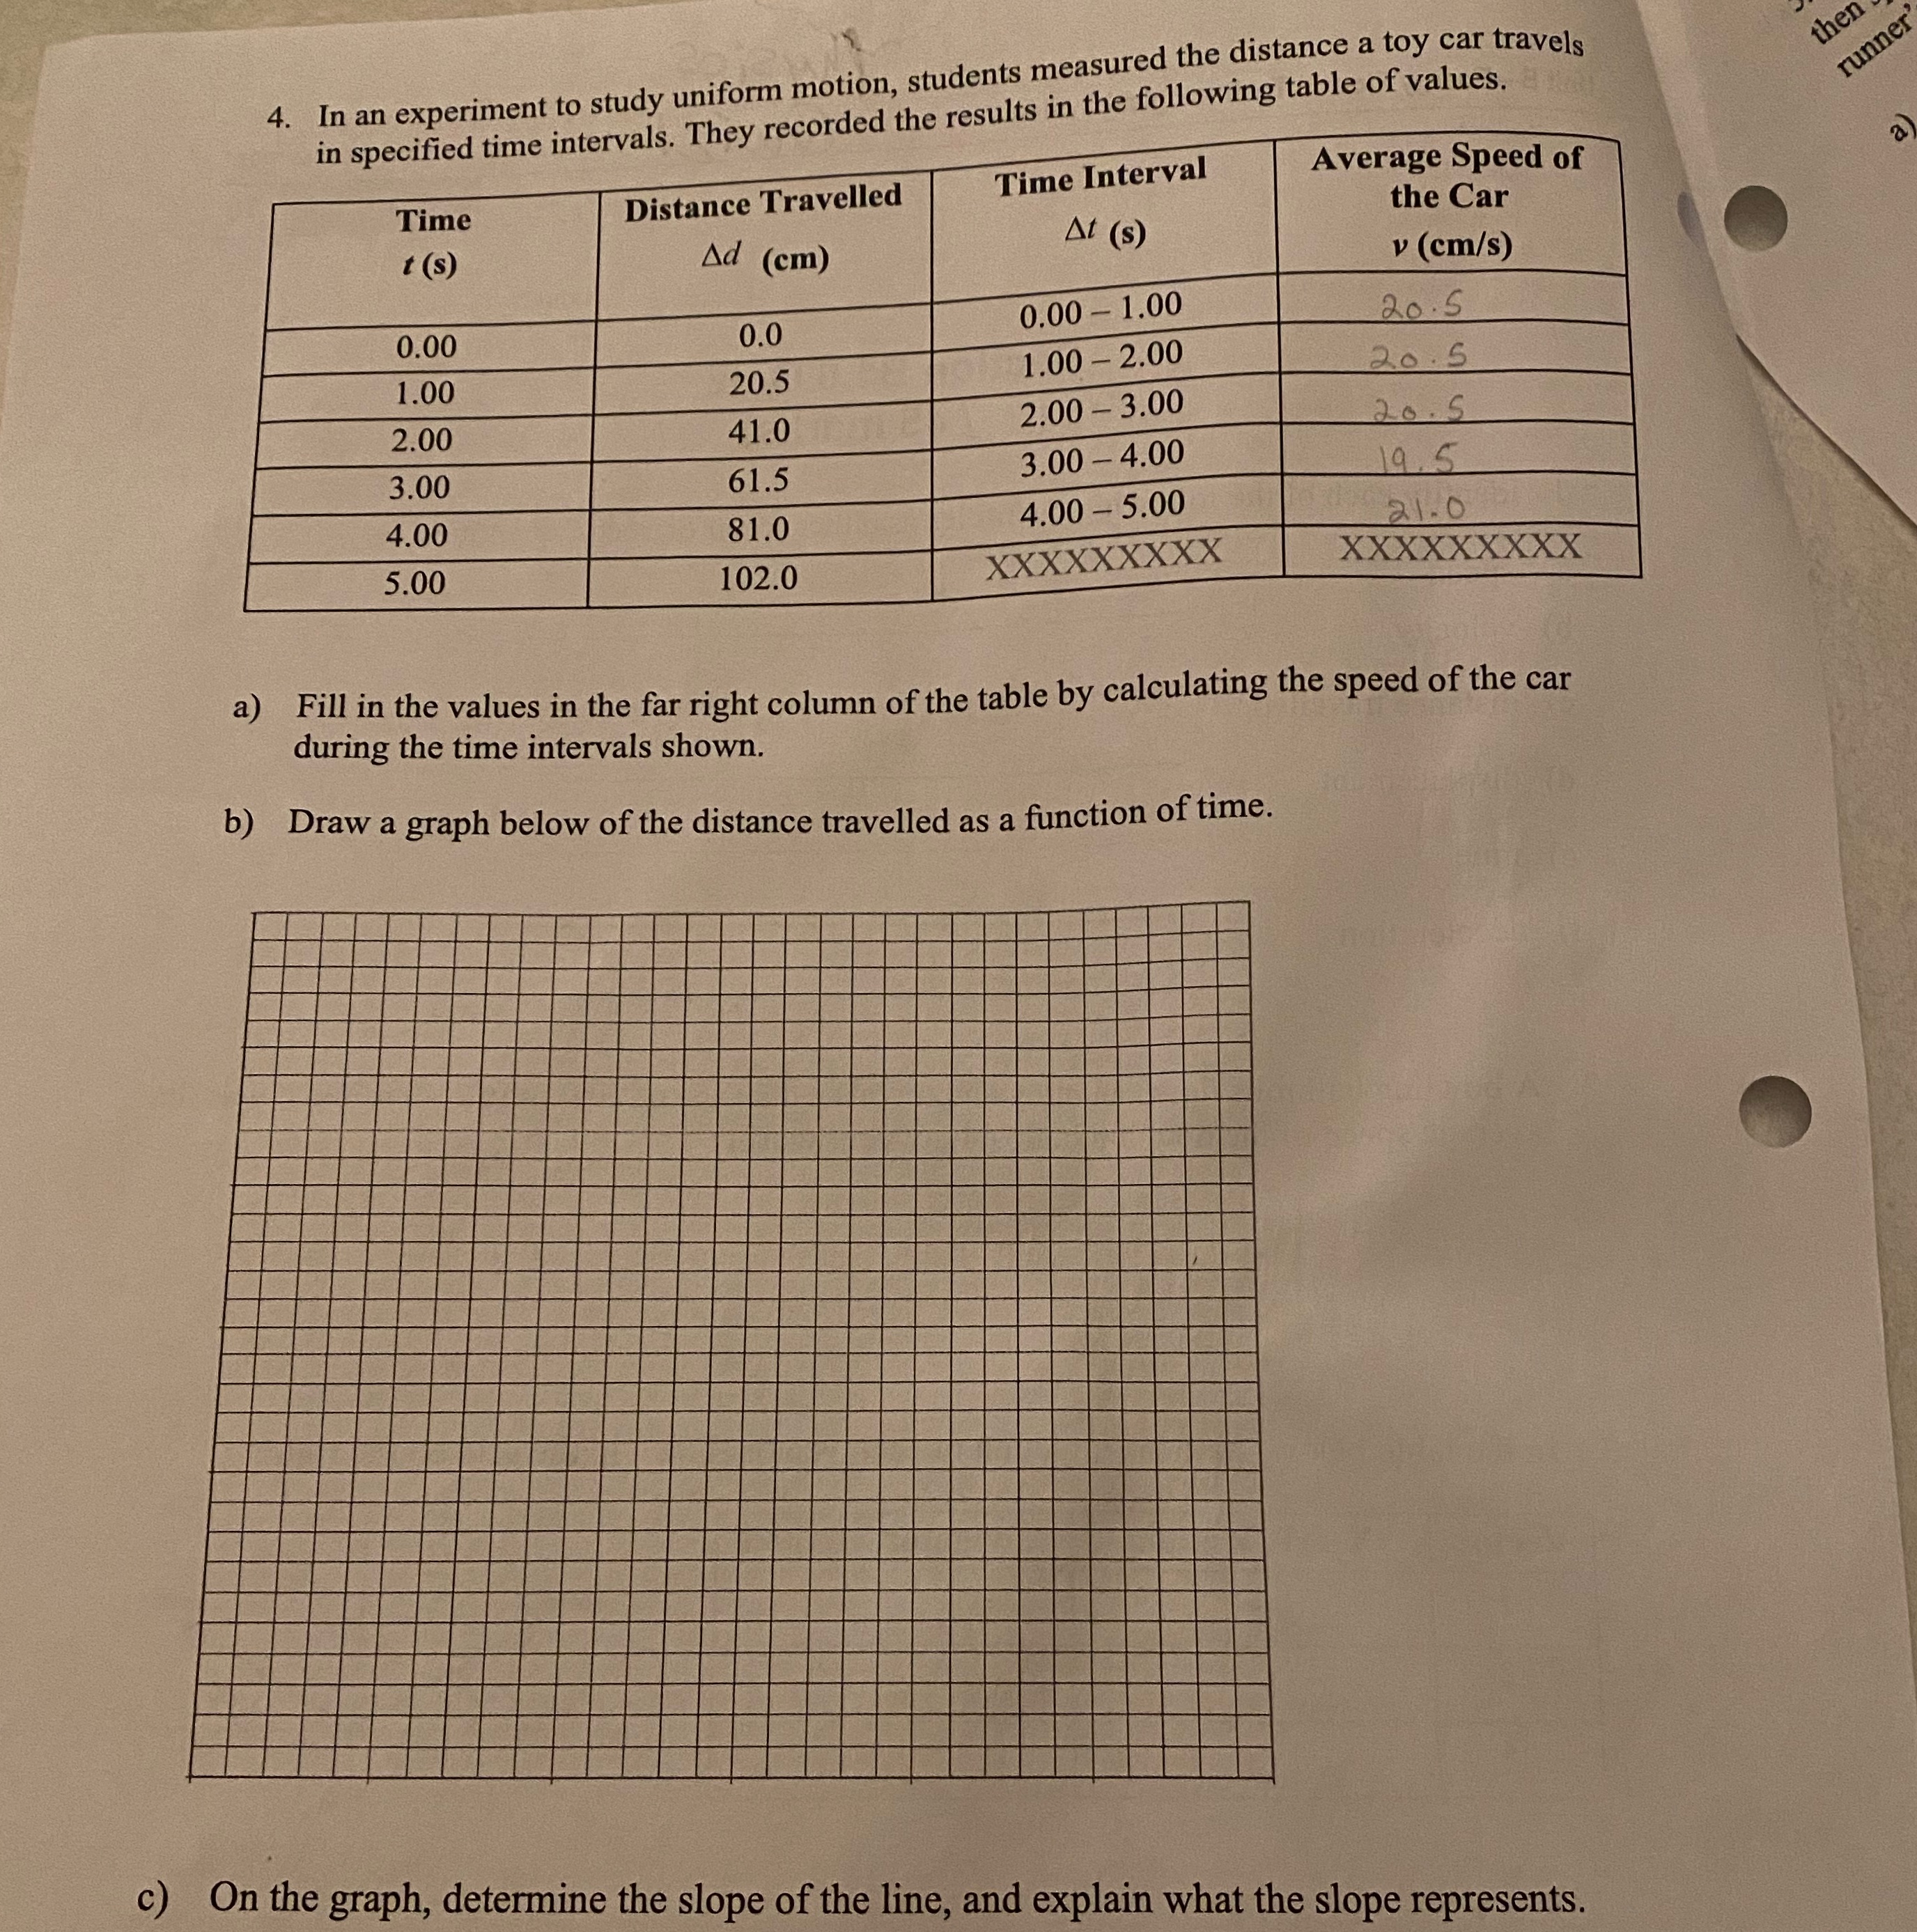
I just need to see how to do the graph thank you! thep 4. In an experiment to study uniform motion, students measured the distance

I just need to see how to do the graph thank you!

image text in transcribed
thep 4. In an experiment to study uniform motion, students measured the distance a toy car travels runner in specified time intervals. They recorded the results in the following table of values. Time Distance Travelled Time Interval Average Speed of the Car t (s) Ad (cm) At (s) v (cm/s) 0.00 0.0 0.00 - 1.00 20 .5 1.00 20.5 1.00 - 2.00 20 . 5 2.00 41.0 2.00 - 3.00 20 . 5 3.00 61.5 3.00 - 4.00 19.5 4.00 81.0 4.00 - 5.00 21.0 5.00 102.0 XXXXXXXXX XXXXXxxxx a) Fill in the values in the far right column of the table by calculating the speed of the car during the time intervals shown. b) Draw a graph below of the distance travelled as a function of time. c) On the graph, determine the slope of the line, and explain what the slope represents

Step by Step Solution

There are 3 Steps involved in it

Step: 1

blur-text-image

Get Instant Access to Expert-Tailored Solutions

See step-by-step solutions with expert insights and AI powered tools for academic success

Step: 2

blur-text-image

Step: 3

blur-text-image

Ace Your Homework with AI

Get the answers you need in no time with our AI-driven, step-by-step assistance

Get Started

Recommended Textbook for

College Physics

Authors: Raymond A. Serway, Jerry S. Faughn, Chris Vuille, Charles A. Bennett

7th Edition

9780534997236, 495113697, 534997236, 978-0495113690

More Books

Students also viewed these Physics questions