

Question
I just want to solve the third part, the first part and the second part that have already been solved pls only question 3 I
I just want to solve the third part, the first part and the second part that have already been solved
pls only question 3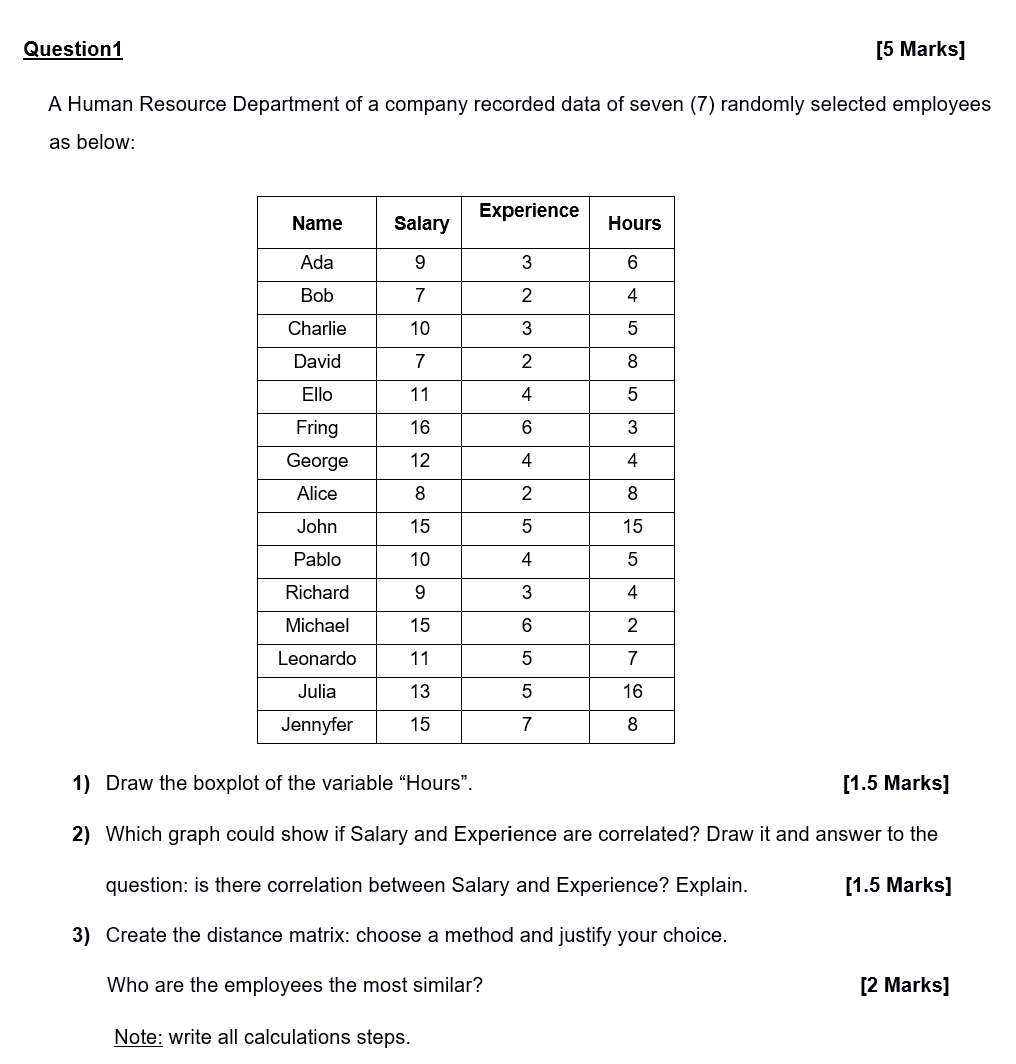
I just want to solve the third part, the first part and the second part that have already been solved
pls only question 3
Question1 [5 Marks] A Human Resource Department of a company recorded data of seven (7) randomly selected employees as below: Experience Name Salary Hours Ada 9 3 6 Bob 7 2 4 10 3 5 Charlie David 7 2 8 Ello 11 4 5 16 6 3 Fring George Alice 12 4 4 8 2 8 John 15 5 15 Pablo 10 4 5 Richard 9 3 4 Michael 15 6 2 Leonardo 11 5 7 Julia 13 5 16 Jennyfer 15 7 8 1) Draw the boxplot of the variable "Hours". [1.5 Marks] 2) Which graph could show if Salary and Experience are correlated? Draw it and answer to the question: is there correlation between Salary and Experience? Explain. [1.5 Marks] 3) Create the distance matrix: choose a method and justify your choice. Who are the employees the most similar? [2 marks] Note: write all calculations stepsStep by Step Solution
There are 3 Steps involved in it
Step: 1

Get Instant Access to Expert-Tailored Solutions
See step-by-step solutions with expert insights and AI powered tools for academic success
Step: 2

Step: 3
Ace Your Homework with AI
Get the answers you need in no time with our AI-driven, step-by-step assistance
Get Started
Fundamentals Of Database Management Systems
Authors: Mark L. Gillenson
3rd Edition
978-1119907466