Answered step by step
Verified Expert Solution
Question
1 Approved Answer
I know there is someone that has done this lab. I need to understand where I went wrong as my Professor does not return emails
I know there is someone that has done this lab. I need to understand where I went wrong as my Professor does not return emails or have lab appointments. Thank you! 

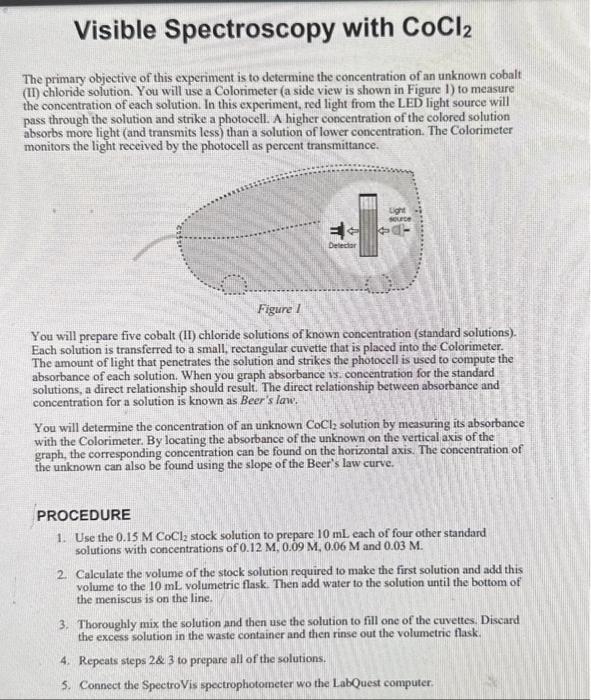
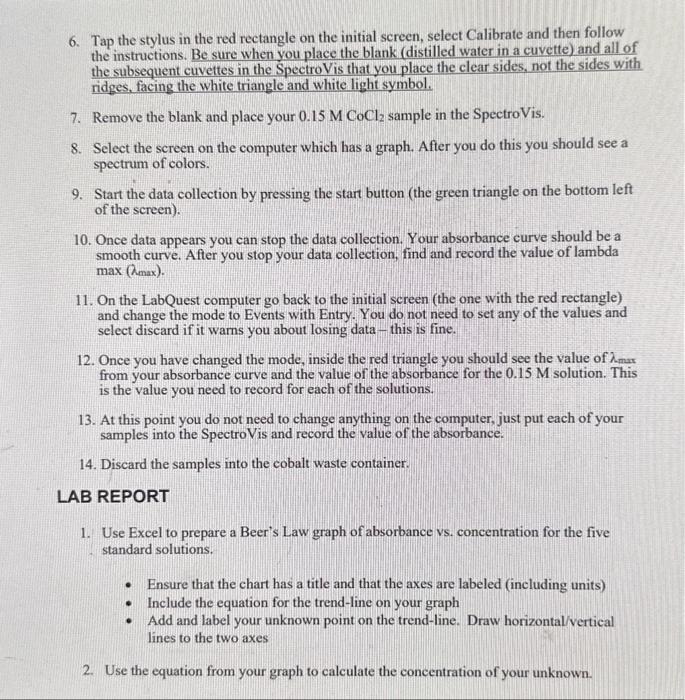
Visible Spectroscopy with CoCl2 The primary objective of this experiment is to determine the concentration of an unknown cobalt (II) chloride solution. You will use a Colorimeter (a side view is shown in Figure 1) to measure the concentration of each solution. In this experiment, red light from the LED light source will pass through the solution and strike a photocell. A higher concentration of the colored solution absorbs more light (and transmits less) than a solution of lower concentration. The Colorimeter monitors the light received by the photocell as percent transmittance. You will prepare five cobalt (II) chloride solutions of known concentration (standard solutions). Each solution is transferred to a small, rectangular cuvette that is placed into the Colorimeter. The amount of light that penetrates the solution and strikes the photocell is used to compute the absorbance of each solution. When you graph absorbance vs. concentration for the standard solutions, a direct relationship should result. The direct relationship between absorbance and concentration for a solution is known as Beer's law. You will determine the concentration of an unknown CoCl2 solution by measuring its absorbance with the Colorimeter. By locating the absorbance of the unknown on the vertical axis of the graph, the corresponding concentration can be found on the horizontal axis. The concentration of the unknown can also be found using the slope of the Beer's law curve. PROCEDURE 1. Use the 0.15MCoCl/2 stock solution to prepare 10mL each of four other standard solutions with concentrations of 0.12M,0.09M,0.06M and 0.03M. 2. Calculate the volume of the stock solution required to make the first solution and add this volume to the 10mL volumetric flask. Then add water to the solution until the bottom of the meniscus is on the line. 3. Thoroughly mix the solution and then use the solution to fill one of the cuvettes. Discard the excess solution in the waste container and then rinse out the volumetric flask. 4. Repeats steps 2&3 to prepare all of the solutions. 5. Connect the SpectroVis spectrophotometer wo the LabQuest computer. 6. Tap the stylus in the red rectangle on the initial screen, select Calibrate and then follow the instructions. Be sure when you place the blank (distilled water in a cuvette) and all of the subsequent cuvettes in the SpectroVis that you place the clear sides, not the sides with ridges, facing the white triangle and white light symbol. 7. Remove the blank and place your 0.15MCoCl2 sample in the SpectroVis. 8. Select the screen on the computer which has a graph. After you do this you should see a spectrum of colors. 9. Start the data collection by pressing the start button (the green triangle on the bottom left of the screen). 10. Once data appears you can stop the data collection. Your absorbance curve should be a smooth curve. After you stop your data collection, find and record the value of lambda max(max). 11. On the LabQuest computer go back to the initial screen (the one with the red rectangle) and change the mode to Events with Entry. You do not need to set any of the values and select discard if it wams you about losing data - this is fine. 12. Once you have changed the mode, inside the red triangle you should see the value of max from your absorbance curve and the value of the absorbance for the 0.15M solution. This is the value you need to record for each of the solutions. 13. At this point you do not need to change anything on the computer, just put each of your samples into the SpectroVis and record the value of the absorbance. 14. Discard the samples into the cobalt waste container. AB REPORT 1. Use Excel to prepare a Beer's Law graph of absorbance vs. concentration for the five standard solutions. - Ensure that the chart has a title and that the axes are labeled (including units) - Include the equation for the trend-line on your graph - Add and label your unknown point on the trend-line. Draw horizontal/vertical lines to the two axes 2. Use the equation from your graph to calculate the concentration of your unknown. Visible Spectroscopy with CoCl2 The primary objective of this experiment is to determine the concentration of an unknown cobalt (II) chloride solution. You will use a Colorimeter (a side view is shown in Figure 1) to measure the concentration of each solution. In this experiment, red light from the LED light source will pass through the solution and strike a photocell. A higher concentration of the colored solution absorbs more light (and transmits less) than a solution of lower concentration. The Colorimeter monitors the light received by the photocell as percent transmittance. You will prepare five cobalt (II) chloride solutions of known concentration (standard solutions). Each solution is transferred to a small, rectangular cuvette that is placed into the Colorimeter. The amount of light that penetrates the solution and strikes the photocell is used to compute the absorbance of each solution. When you graph absorbance vs. concentration for the standard solutions, a direct relationship should result. The direct relationship between absorbance and concentration for a solution is known as Beer's law. You will determine the concentration of an unknown CoCl2 solution by measuring its absorbance with the Colorimeter. By locating the absorbance of the unknown on the vertical axis of the graph, the corresponding concentration can be found on the horizontal axis. The concentration of the unknown can also be found using the slope of the Beer's law curve. PROCEDURE 1. Use the 0.15MCoCl/2 stock solution to prepare 10mL each of four other standard solutions with concentrations of 0.12M,0.09M,0.06M and 0.03M. 2. Calculate the volume of the stock solution required to make the first solution and add this volume to the 10mL volumetric flask. Then add water to the solution until the bottom of the meniscus is on the line. 3. Thoroughly mix the solution and then use the solution to fill one of the cuvettes. Discard the excess solution in the waste container and then rinse out the volumetric flask. 4. Repeats steps 2&3 to prepare all of the solutions. 5. Connect the SpectroVis spectrophotometer wo the LabQuest computer. 6. Tap the stylus in the red rectangle on the initial screen, select Calibrate and then follow the instructions. Be sure when you place the blank (distilled water in a cuvette) and all of the subsequent cuvettes in the SpectroVis that you place the clear sides, not the sides with ridges, facing the white triangle and white light symbol. 7. Remove the blank and place your 0.15MCoCl2 sample in the SpectroVis. 8. Select the screen on the computer which has a graph. After you do this you should see a spectrum of colors. 9. Start the data collection by pressing the start button (the green triangle on the bottom left of the screen). 10. Once data appears you can stop the data collection. Your absorbance curve should be a smooth curve. After you stop your data collection, find and record the value of lambda max(max). 11. On the LabQuest computer go back to the initial screen (the one with the red rectangle) and change the mode to Events with Entry. You do not need to set any of the values and select discard if it wams you about losing data - this is fine. 12. Once you have changed the mode, inside the red triangle you should see the value of max from your absorbance curve and the value of the absorbance for the 0.15M solution. This is the value you need to record for each of the solutions. 13. At this point you do not need to change anything on the computer, just put each of your samples into the SpectroVis and record the value of the absorbance. 14. Discard the samples into the cobalt waste container. AB REPORT 1. Use Excel to prepare a Beer's Law graph of absorbance vs. concentration for the five standard solutions. - Ensure that the chart has a title and that the axes are labeled (including units) - Include the equation for the trend-line on your graph - Add and label your unknown point on the trend-line. Draw horizontal/vertical lines to the two axes 2. Use the equation from your graph to calculate the concentration of your unknown 

Step by Step Solution
There are 3 Steps involved in it
Step: 1

Get Instant Access to Expert-Tailored Solutions
See step-by-step solutions with expert insights and AI powered tools for academic success
Step: 2

Step: 3

Ace Your Homework with AI
Get the answers you need in no time with our AI-driven, step-by-step assistance
Get Started


