Answered step by step
Verified Expert Solution
Question
1 Approved Answer
I mainly need the error calculation in 1 b as well as question 1 a. If cannot be seen the slope in the first graph


I mainly need the error calculation in 1 b as well as question 1 a.
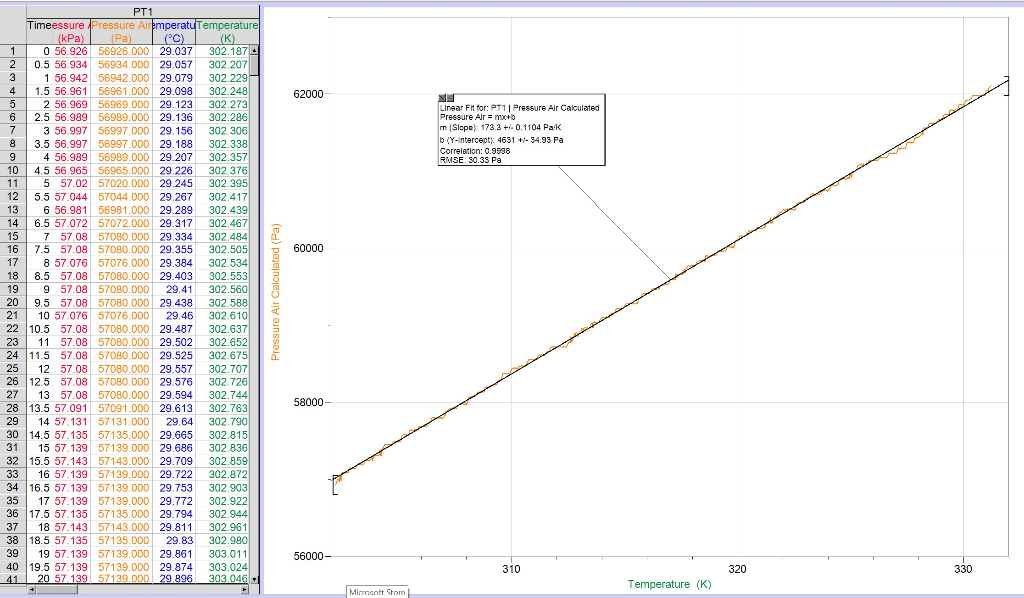
If cannot be seen the slope in the first graph for air = 173.3 Pa/K
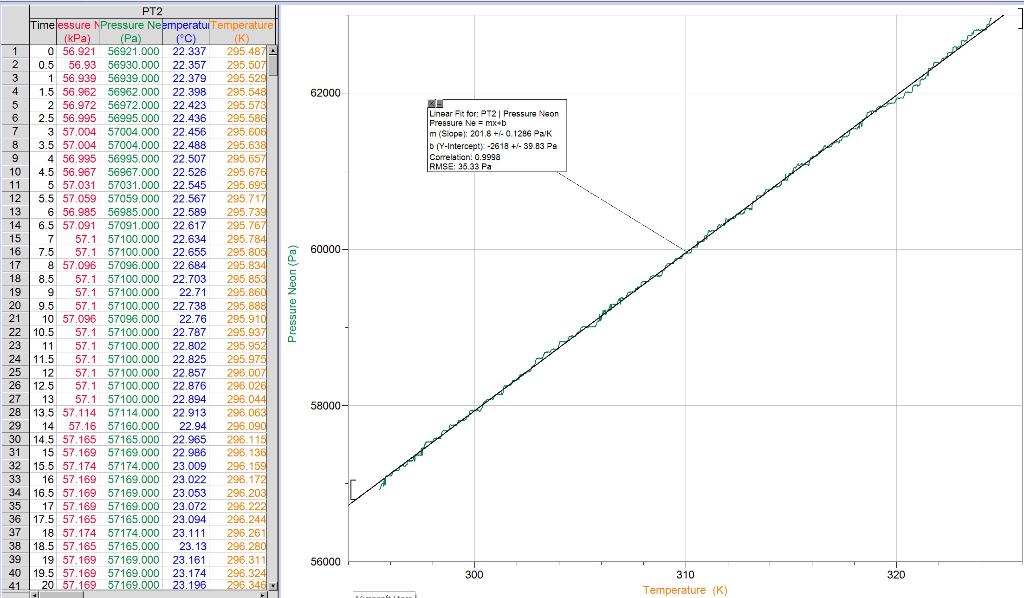
slope for second graph for neon = 201.8 Pa/K
what do you mean by linear regression? I already put the linear regression on the graph and gave the slopes from there.
62000 Linear Fit for: PT1 Pressure Air Calculated Pressure Alr = mx+b m (Slope) 173.3 +/- 0.1104 Pak b (Y-Intercepty: 4581 +/- 34.93 Pa Correlation: 0.9998 RMSE 30.33 Pa 60000 PT1 Timeessure Pressure Airemperatu Temperature (kPa) (Pa) (PC) (K) 1 0 56.926 56926.000 29.037 302.187 2 0.5 56.934 56934.000 29.057 302.207 3 1 56.942 56942.000 29.079 302.229 4 1.5 56.961 56961.000 29.098 302.248 5 2 56.969 56969.000 29.123 302.273 6 2.5 56.989 56989.000 29.136 302.286 7 3 56.997 56997.000 29.156 302 306 8 3.5 56.997 56997.000 29.188 302.338 9 4 56.989 56989.000 29.207 302.357 10 4.5 56.965 56965.000 29.226 302.376 11 5 57.02 57020.000 29.245 302.395 12 5.5 57.044 57044.000 29.267 302.417 13 6 56.981 56981.000 29.289 302.439 14 6.5 57.072 57072.000 29.317 302.467 15 7 57.08 57080.000 29.334 302 484 16 7.5 57.08 57080.000 29.355 302.505 17 8 57.076 57076.000 29.384 302.534 18 8.5 57.08 57080.000 29.403 302.553 19 9 57.08 57080.0DD 29.41 302.560 20 9.5 57.08 57080.000 29.438 302.588 21 10 57.076 57076.000 29.46 302.610 22 10.5 57.08 57080.000 29.487 302.637 23 11 57.08 57080.000 29.502 302.652 24 11.5 57.08 57080.000 29.525 302.675 25 12 57.08 57080.000 29.557 302.707 26 12 5 57 08 57080.000 29.576 302.726 27 13 57.08 57080.000 29.594 302.744 28 13.5 57.091 57091.000 29.613 302.763 29 14 57.131 57131.000 29.64 302.790 30 14.5 57.135 57135.000 29.665 302.815 31 15 57.139 57139.000 29.686 302.836 32 15.5 57.143 57143.000 29.709 302.859 33 16 57.139 57139.000 29.722 302.872 34 16.5 57.139 57139.000 29.753 302.903 35 17 57.139 57139.000 29.772 302.922 36 17.5 57.135 57135.000 29.794 302.944 37 18 57.143 57143.000 29.811 302.961 38 18.5 57.135 57135.000 29.83 302.980 39 19 57.139 57139.000 29.861 303.011 40 19.5 57.139 57139.000 29.874 303.024 41 20 57.139 57139.000 29.896 303.046 Pressure Air Calculated (Pa) 58000 56000- 310 320 330 Temperature (K) Microsoft Store 1 62000 KET Linear Fit for: PT2 Pressure Neon Pressure Ne = mx+b m (Slope) 2018 +/- 0.1286 Pak bY-Intercepty -2618 +/- 39.83 PG Correlation: 0.9998 RMSE: 36.33 Pa 60000- PT2 Time essure Pressure Neemperatur Temperature (kPa) (Pa) (K) 0 56.921 56921.000 22.337 295.4872 2 0.5 56.93 56930.000 22.357 295.507 3 1 56.939 56939.000 22.379 295.529 4 1.5 56.962 56962.000 22.398 295.548 5 2 56.972 56972.000 22.423 295.573 6 2.5 56.995 56995.000 22.436 295.5861 7 3 57004 57004.000 22.456 295.606 8 3.5 57.004 57004.000 22.488 295.638 9 4 56.995 56995,000 22,507 295 657 10 4.5 56.967 56967.000 22.526 295.676 11 5 57.031 57031.000 22.545 295.695 12 5.5 57.059 57059.000 22.567 295.717 13 6 56.985 56985.000 22.589 295.739 14 6.5 57.091 57091.000 22.617 295.7671 15 7 57.1 57100.000 22.634 295.784 16 7.5 57.1 57100.000 22.655 295.8051 17 8 57.096 57096.000 22.684 295.834 18 8.5 57.1 57100.000 22.703 295.853 19 9 57.1 57100.000 22.71 295.860 20 9.5 57.1 57100.000 22.738 295.888 21 10 57.096 57096.000 22.76 295.910 22 10.5 57.1 57100.000 22.787 295.937 23 11 57.1 57100.000 22.802 295.952 24 11.5 57.1 57100.000 22.825 295.9751 25 12 57.1 57100.000 22.857 296.007 26 12.5 57.1 57100.000 22.876 296.02 27 13 57.1 57100.000 22.894 296.044 28 13.5 57.114 57114,000 22.913 296.063 29 14 57.16 57160.000 22.94 296.090 30 14.5 57 165 57165.000 22.965 296. 115 31 15 57.169 57169.000 22.986 296.13 32 15.5 57.174 57174.000 23.009 296.159 33 16 57.169 57169.000 23.022 296. 172 34 16.5 57.169 57169.000 23.053 296.203 35 17 57.169 57169.000 23.072 296.222 36 17.5 57.165 57165.000 23.094 296.244 37 18 57.174 57174.000 23.111 296.261 38 18.5 57.165 57165.000 23.13 296.280 39 19 57.169 57169.000 23.161 296.311 40 19.5 57.169 57169.000 23.174 296.324 41 20 57.169 57169.000 23.196 296 346 Pressure Neon (Pa) 58000- 56000 300 320 310 Temperature (K) Calculation 1b: 3 pts Using the slopes of the linear regressions for Graph 1, calculate the volume for one mole of each gas. Be sure to include the error calculations. Question 1a: 2 pts Do the values in Calc. 1a and Calc. 1b agree with each other for the volume per mole for air and neon? Typically, you can assume that two calculated values agree if one of them falls within the range of uncertainty for the second oneStep by Step Solution
There are 3 Steps involved in it
Step: 1

Get Instant Access to Expert-Tailored Solutions
See step-by-step solutions with expert insights and AI powered tools for academic success
Step: 2

Step: 3

Ace Your Homework with AI
Get the answers you need in no time with our AI-driven, step-by-step assistance
Get Started


