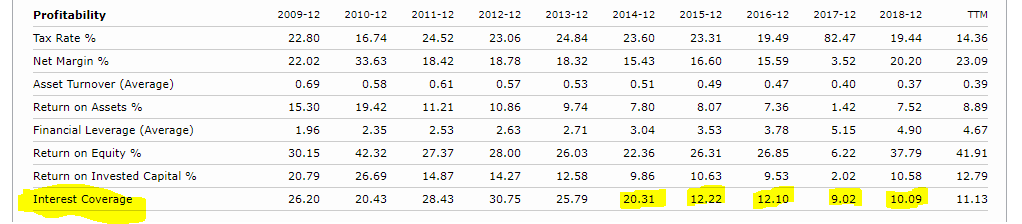
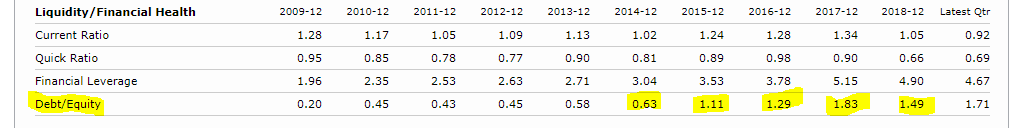
I need assistance answering the following questions based on the Coca Cola's Debt-To-Equity, Interest Coverage, and Debt-To-Total-Asset ratios attached from the last 5 years which
I need assistance answering the following questions based on the Coca Cola's Debt-To-Equity, Interest Coverage, and Debt-To-Total-Asset ratios attached from the last 5 years which i highlighted. Thanks in advance...
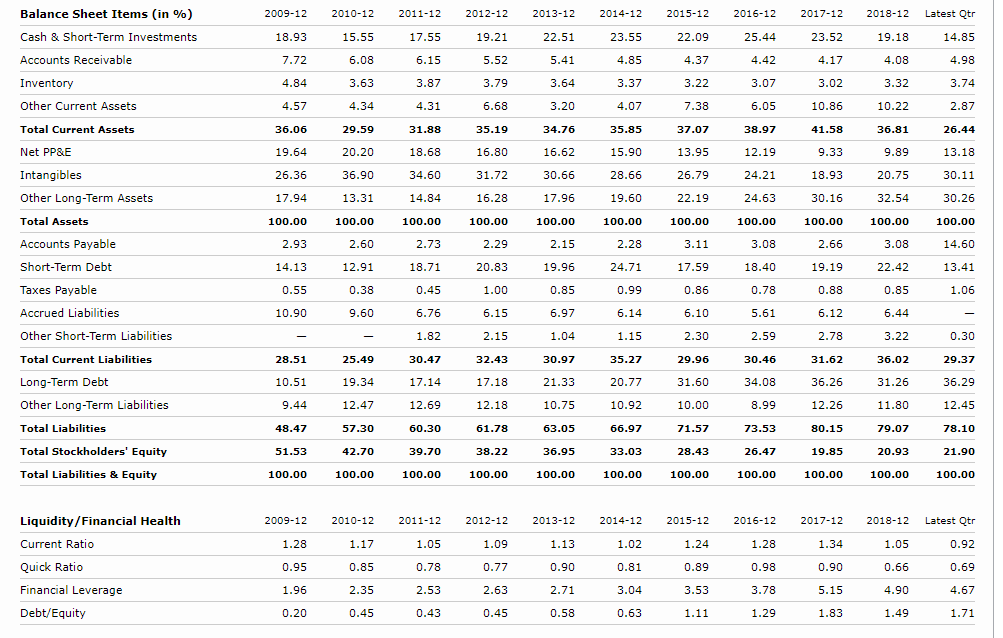
How is Coca Cola financing its assets? How much risk is associated with the bonds issued by the company? How can this risk be measured? Please explain.
________________________________________________________________________________________________________________________________
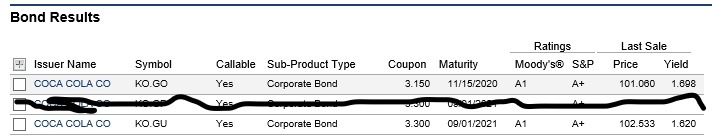
Also, with the 2 bonds quotation issued by the company which i have attached as well, please help me answer the following questions:
- Assume that par value of the bond is $1,000. What were the last prices of the bonds in $$$ (listed in the Price column)? Show your work please.
- Assume that par value of the bond is $1,000. Calculate the annual coupon interest payments. Show your work please.
- Assume that par value of the bond is $1,000. Calculate the current yield of the bonds. Show your work please.
-
- How much is the YTM listed in quotations is for the bonds? Explain the meaning of YTM.
- which bond would be preferable to buy? Why?
- Are these bonds callable? If the bonds chosen are callable (non-callable), will it change the decision to buy them?
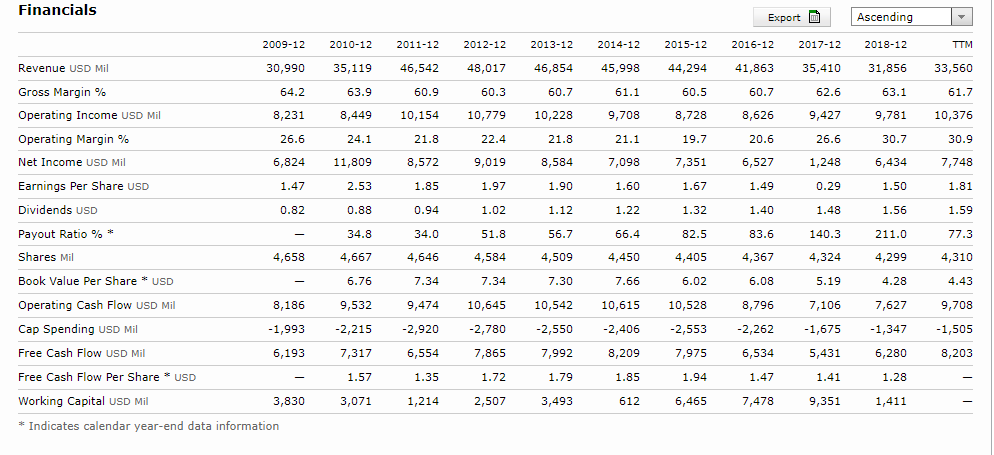
- If you are an investor who is looking for a bond to invest in, are you going to buy a bond that you chose? Take a look at the balance sheet and income statement of the company. What data or ratios support your decision to buy this bond or not?.

Profitability TTM Tax Rate % Net Margin % 2009-12 22.80 22.02 0.69 15.30 1.96 30.15 20.79 26.20 Asset Turnover (Average) Return on Assets % Financial Leverage (Average) Return on Equity % Return on Invested Capital % Interest Coverage 2010-12 16.74 33.63 0.58 19.42 2.35 42.32 26.69 20.43 2011-12 24.52 18.42 0.61 11.21 2.53 27.37 14.87 28.43 2012-12 23.06 18.78 0.57 10.86 2.63 28.00 14.27 30.75 2013-12 24.84 18.32 0.53 9.74 2.71 26.03 12.58 25.79 2014-12 23.60 15.43 0.51 7.80 3.04 22.36 9.86 20.31 2015-12 23.31 16.60 0.49 8.07 3.53 26.31 10.63 12.22 2015-12 19.49 15.59 0 .47 7.36 3.78 26.85 9.53 12.10 2017-12 82.47 3.52 0.40 1.42 5.15 6.22 2.02 9.02 2018-12 19.44 20.20 0.37 7.52 4.90 37.79 10.58 10.09 14.36 23.09 0.39 8.89 4.67 41.91 12.79 11.13 Coca-Cola Co Annual Data Dec13 Dec14 Dec10 Dec11 Dec12 Dec15 Dec17 Dec16 0.34 Dec18 0.31 Dec 19 0.32 LT-Debt-to-Total-Asset 0.32 0.36 2013-12 Latest Qtr Liquidity/Financial Health Current Ratio Quick Ratio Financial Leverage Debt/Equity 2009-12 1.28 0.95 1.96 2010-12 2011-12 1.171 .05 0.85 0.78 2.35 2.53 0.45 0.43 2012-12 1.09 0.77 2.63 0.45 2013-12 1.13 0.90 2.71 0.58 2014-12 1.02 0.81 3.04 0.63 2015-12 1 .24 0.89 3.53 1.11 2015-12 1.28 0.98 3.78 1.29 2017-12 1.34 0.90 5.15 1.83 4 .90 1.49 0.69 4.67 1.71 Bond Results Issuer Name COCA COLA CO Symbol KO.GO Callable Yes Sub-Product Type Corporate Bond Ratings Moody's S&P A1 A+ Last Sale Price Yield 101.080 1.898 Coupon Maturity 3.150 11/15/2020 OU UN 3.300 09/01/2021 N COCA COLA COKO.GU Yes Corporate Bond A1 A+ 102.533 1.820 Balance Sheet Items (in %) Cash & Short-Term Investments Accounts Receivable 2009-12 18.93 7.72 4.84 Inventory Other Current Assets 4.57 2010-12 15.55 6.08 3.63 4.34 29.59 20.20 36.90 13.31 100.00 2011-12 17.55 6.15 3 .87 4.31 31.88 18.68 34.60 14.84 100.00 2012-12 19.21 5.52 3.79 6.68 35.19 16.80 31.72 16.28 100.00 Total Current Assets Net PP&E Intangibles Other Long-Term Assets 36.06 19.64 26.36 17.94 100.00 2.93 Total Assets 2.60 2.73 2.29 2013-12 22.51 5 .41 3.64 3.20 3 4.76 16.62 30.66 17.96 100.00 2.15 19.96 0.85 6.97 1.04 30.97 21.33 10.75 63.05 36.95 100.00 Accounts Payable Short-Term Debt Taxes Payable 2014-12 23.55 4.85 3.37 4.07 35.85 15.90 28.66 19.60 100.00 2.28 24.71 0.99 6.14 1 .15 35.27 20.77 10.92 66.97 33.03 100.00 Latest Qtr 14.85 4.98 3.74 2.87 26.44 13.18 30.11 30.26 100.00 14.60 13.41 1.05 - 0.30 29.37 36.29 12.45 2015-12 22.09 4.37 3.22 7.38 37.07 13.95 26.79 2 2.19 100.00 3.11 17.59 0.86 6.10 2.30 29.96 31.60 10.00 71.57 28.43 100.00 2016-12 2 5.44 4.42 3.07 6.05 38.97 12.19 24.21 2 4.63 100.00 3.08 18.40 0.78 5.61 2.59 30.46 34.08 8.99 73.53 26.47 100.00 2017-12 23.52 4.17 3.02 10.86 41.58 9 .33 18.93 30.16 100.00 2.66 19.19 0.88 6 .12 2.78 31.62 36.26 12.26 80.15 19.85 100.00 2018-12 19.18 4.08 3.32 10.22 36.81 9 .89 20.75 32.54 100.00 3.08 22.42 0.85 6.44 3.22 36.02 31.26 11.80 79.07 20.93 100.00 Accrued Liabilities Other Short-Term Liabilities Total Current Liabilities Long-Term Debt Other Long-Term Liabilities Total Liabilities 14.13 0.55 10.90 - 28.51 10.51 9.44 12.91 0.38 9.60 - 25.49 19.34 12.47 57.30 42.70 100.00 18.71 0.45 6.76 1.82 30.47 17.14 12.69 60.30 39.70 100.00 20.83 1.00 6.15 2.15 32.43 17.18 12.18 6 1.78 38.22 100.00 78.10 48.47 51.53 21.90 Total Stockholders' Equity Total Liabilities & Equity 100.00 100.00 Liquidity/Financial Health Current Ratio Quick Ratio Financial Leverage Debt/Equity 2009-12 1.28 0.95 1.96 0.20 2010-12 1.17 0.85 2.35 0.45 2011-12 2012-12 1.051.09 0.78 0.77 2.53 2.63 0.43 0.45 2013-12 1.13 0.90 2.71 0.58 2014-12 1.02 0.81 3.04 0.63 2015-12 1.24 0.89 3.53 1.11 2015-12 1.28 0.98 3.78 1.29 2017-12 1.34 0.90 5.15 1.83 2013-12 1.05 0.66 4 .90 1.49 Latest Qtr 0.92 0.69 4.67 1.71 Financials Revenue USD Mil Gross Margin % Operating Income USD Mil Operating Margin % Net Income USD Mil Earnings Per Share USD Dividends USD Payout Ratio %* Shares Mil - TTM 33,560 61.7 10,376 30.9 7,748 1.81 2009-12 2010-12 2011-12 30,990 35,119 45,542 64.2 63.9 60.9 8,231 8,449 10,154 26.6 24. 1 2 1.8 6,824 11,809 8,572 1.47 2.53 1.85 0.82 0.88 0.94 - 34.8 34.0 4,658 4,667 4,646 - 6.76 7.34 8,186 9,532 9,474 -1,993 -2,215 -2,920 6,193 7,317 6,554 - 1.571.35 3,8303,071 1,214 1.59 2012-12 2013-12 48,017 46,854 60.3 60.7 10,779 10,228 22.4 21.8 9,019 8,584 1.97 1.90 1.02 1.12 51.8 56. 7 4 ,584 4,509 7.34 7 .30 10,645 10,542 -2,780 -2,550 7,365 7,992 1.72 1.79 2,5073,493 2014-12 45,998 61.1 9,708 21.1 7,098 1.60 1.22 6 6.4 4,450 7.66 10,615 -2,406 8,209 1.85 612 Export D Ascending 2015-12 2017-12 2013-12 41,863 35,410 31,856 60.7 52.6 63.1 8,626 9,427 9,781 20.6 26.6 30.7 6 ,527 1,248 6,434 1.49 0 .29 1.50 1.40 1.48 1.56 83.6 140.3 211.0 4,367 4 ,324 4,299 6.08 5.194 .28 8 ,796 7,106 7,627 -2,262 -1,675 -1,347 6,534 5,431 6,280 1.471.41 1.28 7,478 9,351 1,411 2015-12 44,294 60.5 8,728 19.7 7,351 1.67 1.32 82.5 4,405 6.02 10,528 -2,553 7,975 1.94 6,465 Book Value Per Share * USD 77.3 4,310 4.43 9,708 -1,505 3,203 Operating Cash Flow USD Mil Cap Spending USD Mil Free Cash Flow USD Mil Free Cash Flow Per Share * USD Working Capital USD Mil * Indicates calendar year-end data information Profitability TTM Tax Rate % Net Margin % 2009-12 22.80 22.02 0.69 15.30 1.96 30.15 20.79 26.20 Asset Turnover (Average) Return on Assets % Financial Leverage (Average) Return on Equity % Return on Invested Capital % Interest Coverage 2010-12 16.74 33.63 0.58 19.42 2.35 42.32 26.69 20.43 2011-12 24.52 18.42 0.61 11.21 2.53 27.37 14.87 28.43 2012-12 23.06 18.78 0.57 10.86 2.63 28.00 14.27 30.75 2013-12 24.84 18.32 0.53 9.74 2.71 26.03 12.58 25.79 2014-12 23.60 15.43 0.51 7.80 3.04 22.36 9.86 20.31 2015-12 23.31 16.60 0.49 8.07 3.53 26.31 10.63 12.22 2015-12 19.49 15.59 0 .47 7.36 3.78 26.85 9.53 12.10 2017-12 82.47 3.52 0.40 1.42 5.15 6.22 2.02 9.02 2018-12 19.44 20.20 0.37 7.52 4.90 37.79 10.58 10.09 14.36 23.09 0.39 8.89 4.67 41.91 12.79 11.13 Coca-Cola Co Annual Data Dec13 Dec14 Dec10 Dec11 Dec12 Dec15 Dec17 Dec16 0.34 Dec18 0.31 Dec 19 0.32 LT-Debt-to-Total-Asset 0.32 0.36 2013-12 Latest Qtr Liquidity/Financial Health Current Ratio Quick Ratio Financial Leverage Debt/Equity 2009-12 1.28 0.95 1.96 2010-12 2011-12 1.171 .05 0.85 0.78 2.35 2.53 0.45 0.43 2012-12 1.09 0.77 2.63 0.45 2013-12 1.13 0.90 2.71 0.58 2014-12 1.02 0.81 3.04 0.63 2015-12 1 .24 0.89 3.53 1.11 2015-12 1.28 0.98 3.78 1.29 2017-12 1.34 0.90 5.15 1.83 4 .90 1.49 0.69 4.67 1.71 Bond Results Issuer Name COCA COLA CO Symbol KO.GO Callable Yes Sub-Product Type Corporate Bond Ratings Moody's S&P A1 A+ Last Sale Price Yield 101.080 1.898 Coupon Maturity 3.150 11/15/2020 OU UN 3.300 09/01/2021 N COCA COLA COKO.GU Yes Corporate Bond A1 A+ 102.533 1.820 Balance Sheet Items (in %) Cash & Short-Term Investments Accounts Receivable 2009-12 18.93 7.72 4.84 Inventory Other Current Assets 4.57 2010-12 15.55 6.08 3.63 4.34 29.59 20.20 36.90 13.31 100.00 2011-12 17.55 6.15 3 .87 4.31 31.88 18.68 34.60 14.84 100.00 2012-12 19.21 5.52 3.79 6.68 35.19 16.80 31.72 16.28 100.00 Total Current Assets Net PP&E Intangibles Other Long-Term Assets 36.06 19.64 26.36 17.94 100.00 2.93 Total Assets 2.60 2.73 2.29 2013-12 22.51 5 .41 3.64 3.20 3 4.76 16.62 30.66 17.96 100.00 2.15 19.96 0.85 6.97 1.04 30.97 21.33 10.75 63.05 36.95 100.00 Accounts Payable Short-Term Debt Taxes Payable 2014-12 23.55 4.85 3.37 4.07 35.85 15.90 28.66 19.60 100.00 2.28 24.71 0.99 6.14 1 .15 35.27 20.77 10.92 66.97 33.03 100.00 Latest Qtr 14.85 4.98 3.74 2.87 26.44 13.18 30.11 30.26 100.00 14.60 13.41 1.05 - 0.30 29.37 36.29 12.45 2015-12 22.09 4.37 3.22 7.38 37.07 13.95 26.79 2 2.19 100.00 3.11 17.59 0.86 6.10 2.30 29.96 31.60 10.00 71.57 28.43 100.00 2016-12 2 5.44 4.42 3.07 6.05 38.97 12.19 24.21 2 4.63 100.00 3.08 18.40 0.78 5.61 2.59 30.46 34.08 8.99 73.53 26.47 100.00 2017-12 23.52 4.17 3.02 10.86 41.58 9 .33 18.93 30.16 100.00 2.66 19.19 0.88 6 .12 2.78 31.62 36.26 12.26 80.15 19.85 100.00 2018-12 19.18 4.08 3.32 10.22 36.81 9 .89 20.75 32.54 100.00 3.08 22.42 0.85 6.44 3.22 36.02 31.26 11.80 79.07 20.93 100.00 Accrued Liabilities Other Short-Term Liabilities Total Current Liabilities Long-Term Debt Other Long-Term Liabilities Total Liabilities 14.13 0.55 10.90 - 28.51 10.51 9.44 12.91 0.38 9.60 - 25.49 19.34 12.47 57.30 42.70 100.00 18.71 0.45 6.76 1.82 30.47 17.14 12.69 60.30 39.70 100.00 20.83 1.00 6.15 2.15 32.43 17.18 12.18 6 1.78 38.22 100.00 78.10 48.47 51.53 21.90 Total Stockholders' Equity Total Liabilities & Equity 100.00 100.00 Liquidity/Financial Health Current Ratio Quick Ratio Financial Leverage Debt/Equity 2009-12 1.28 0.95 1.96 0.20 2010-12 1.17 0.85 2.35 0.45 2011-12 2012-12 1.051.09 0.78 0.77 2.53 2.63 0.43 0.45 2013-12 1.13 0.90 2.71 0.58 2014-12 1.02 0.81 3.04 0.63 2015-12 1.24 0.89 3.53 1.11 2015-12 1.28 0.98 3.78 1.29 2017-12 1.34 0.90 5.15 1.83 2013-12 1.05 0.66 4 .90 1.49 Latest Qtr 0.92 0.69 4.67 1.71 Financials Revenue USD Mil Gross Margin % Operating Income USD Mil Operating Margin % Net Income USD Mil Earnings Per Share USD Dividends USD Payout Ratio %* Shares Mil - TTM 33,560 61.7 10,376 30.9 7,748 1.81 2009-12 2010-12 2011-12 30,990 35,119 45,542 64.2 63.9 60.9 8,231 8,449 10,154 26.6 24. 1 2 1.8 6,824 11,809 8,572 1.47 2.53 1.85 0.82 0.88 0.94 - 34.8 34.0 4,658 4,667 4,646 - 6.76 7.34 8,186 9,532 9,474 -1,993 -2,215 -2,920 6,193 7,317 6,554 - 1.571.35 3,8303,071 1,214 1.59 2012-12 2013-12 48,017 46,854 60.3 60.7 10,779 10,228 22.4 21.8 9,019 8,584 1.97 1.90 1.02 1.12 51.8 56. 7 4 ,584 4,509 7.34 7 .30 10,645 10,542 -2,780 -2,550 7,365 7,992 1.72 1.79 2,5073,493 2014-12 45,998 61.1 9,708 21.1 7,098 1.60 1.22 6 6.4 4,450 7.66 10,615 -2,406 8,209 1.85 612 Export D Ascending 2015-12 2017-12 2013-12 41,863 35,410 31,856 60.7 52.6 63.1 8,626 9,427 9,781 20.6 26.6 30.7 6 ,527 1,248 6,434 1.49 0 .29 1.50 1.40 1.48 1.56 83.6 140.3 211.0 4,367 4 ,324 4,299 6.08 5.194 .28 8 ,796 7,106 7,627 -2,262 -1,675 -1,347 6,534 5,431 6,280 1.471.41 1.28 7,478 9,351 1,411 2015-12 44,294 60.5 8,728 19.7 7,351 1.67 1.32 82.5 4,405 6.02 10,528 -2,553 7,975 1.94 6,465 Book Value Per Share * USD 77.3 4,310 4.43 9,708 -1,505 3,203 Operating Cash Flow USD Mil Cap Spending USD Mil Free Cash Flow USD Mil Free Cash Flow Per Share * USD Working Capital USD Mil * Indicates calendar year-end data information