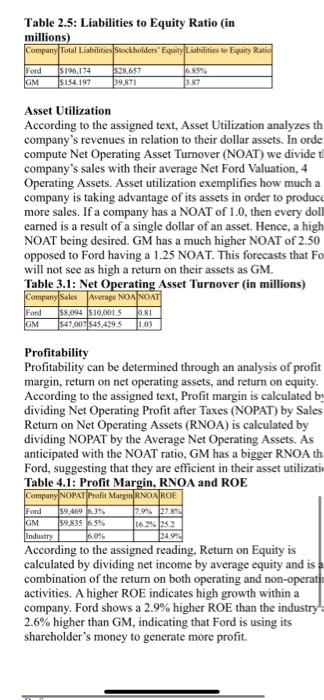
I need assistance with step two of my project i chose Ford Motor Company please lmk if you need any additional information.
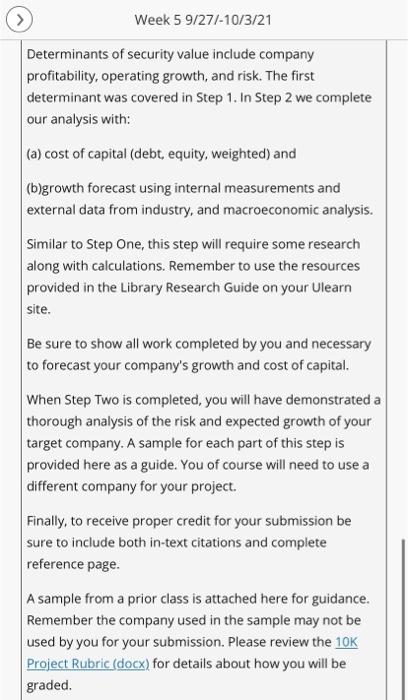
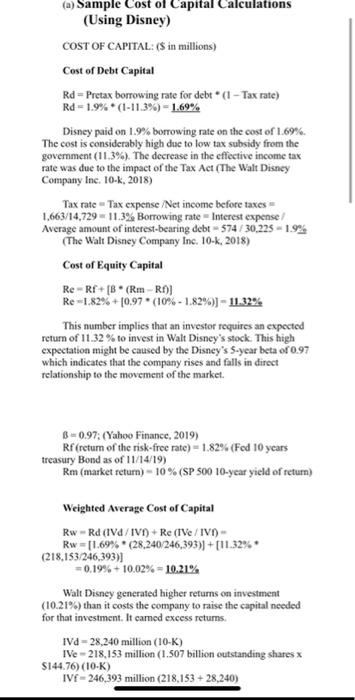
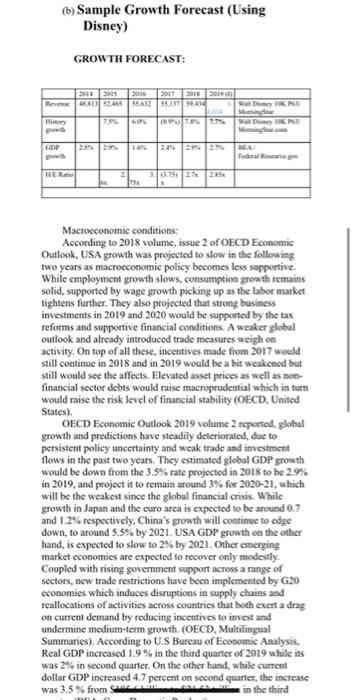
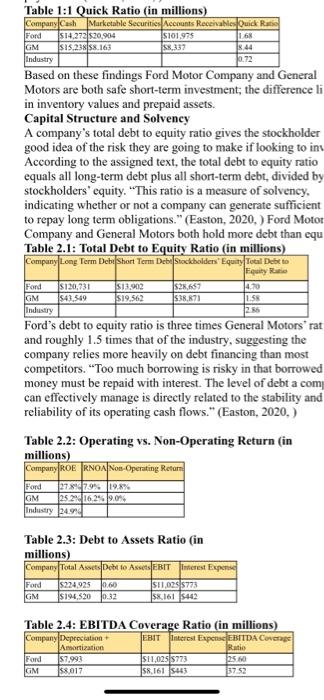
Week 5 9/27/-10/3/21 Determinants of security value include company profitability, operating growth, and risk. The first determinant was covered in Step 1. In Step 2 we complete our analysis with: (a) cost of capital (debt, equity, weighted) and (b)growth forecast using internal measurements and external data from industry, and macroeconomic analysis. Similar to Step One, this step will require some research along with calculations. Remember to use the resources provided in the Library Research Guide on your Ulearn site. Be sure to show all work completed by you and necessary to forecast your company's growth and cost of capital. When Step Two is completed, you will have demonstrated a thorough analysis of the risk and expected growth of your target company. A sample for each part of this step is provided here as a guide. You of course will need to use a different company for your project. Finally, to receive proper credit for your submission be sure to include both in-text citations and complete reference page. A sample from a prior class is attached here for guidance. Remember the company used in the sample may not be used by you for your submission. Please review the 10K Project Rubric (docx) for details about how you will be graded. (a) Sample Cost of Capital Calculations (Using Disney) COST OF CAPITAL: ($ in millions) Cost of Debt Capital Rd - Pretax borrowing rate for debt * -Tax rate) Rd -1.9%* (1-11.3%) - 1.69% Disney paid on 1.9% borrowing rate on the cost of 1.69%. The cost is considerably high due to low tax subsidy from the government (11.3%). The decrease in the effective income tax rate was due to the impact of the Tax Act (The Walt Disney Company Inc. 10-K, 2018) Tax rate Tax expense /Net income before taxes = 1.663/14,729 11.3% Borrowing rate Interest expense Average amount of interest-bearing debt 574/30.225 -1.9% (The Walt Disney Company Inc. 10-k. 2018) Cost of Equity Capital Re-Rf+[B(Rm - RJ Re-1.82% +10,97 * (10% - 1.82%) 11.32% This number implies that an investor requires an expected return of 11.32% to invest in Walt Disney's stock. This high expectation might be caused by the Disney's S-year beta or 0.97 which indicates that the company rises and falls in direct relationship to the movement of the market. 8 -0.97. (Yahoo Finance, 2019) Rf (return of the risk-free rate) - 1.82% (Fed 10 years treasury Bond as of 11/14/19) Rm (market return) - 10% (SP 500 10-year yield of return) Weighted Average Cost of Capital Rw Rd (IV/IVT + Re (IV/IVO - Rw=1169% (28.240/246,393)] + [11.32% (218,153 246,393)] +0.19% + 10.02% - 10.21% Walt Disney generated higher returns on investment (10.21%) than it costs the company to raise the capital needed for that investment. It camed excess retums. IVd - 28,240 million (10-K) Ie 218,153 million (1.507 billion outstanding shares x $144.76) (10-K) IVF-246,393 million (218,153 +28.240) (b) Sample Growth Forecast (Using Disney) GROWTH FORECAST: 2016 2015 2056 2017 2017 RUSLAN 542 55.5243 SDM 7950 R15 GOP 2392 24 25 26 BEA HER 0.750 22 25 Macroeconomic conditions: According to 2018 volume, issue 2 of OECD Economic Outlook, USA growth was projected to slow in the following two years as macroeconomic policy becomes less supportive While employment growth slows, consumption growth remains solid, supported by wage growth picking up as the labor market tightens further. They also projected that strong business investments in 2019 and 2020 would be supported by the tax reforms and supportive financial conditions. A weaker global outlook and already introduced trade measures weigh on activity. On top of all these, incentives made from 2017 would still continue in 2018 and in 2019 would be a bit weakened but still would see the affects. Elevated asset prices as well as non- financial sector debts would raise macroprudential which in turn would raise the risk level of financial stability (OECD. United States). OECD Economic Outlook 2019 volume 2 reported, global growth and predictions have steadily deteriorated, due to persistent policy uncertainty and weak trade and investment flows in the past two years. They estimated global GDP growth would be down from the 3.5% rate projected in 2018 to be 29% in 2019, and project it to remain around 3% for 2020-21, which will be the weakest since the global financial crisis. While growth in Japan and the curo arca is expected to be around 0.7 and 1.2% respectively, China's growth will continue to edge down, to around 5.5% by 2021. USA GDP growth on the other hand, is expected to slow to 2% by 2021. Other emerging market economies are expected to recover only modestly Coupled with rising government support across a range of sectors, new trade restrictions have been implemented by G20 economies which induces disruptions in supply chains and reallocations of activities across countries that both exert a drag on current demand by reducing incentives to invest and undermine medium-term growth. (OECD, Multilingual Summaries). According to U.S Bureau of Economic Analysis, Real GDP increased 1.9% in the third quarter of 2019 while its was 2% in second quarter. On the other hand, while current dollar GDP increased 4.7 percent on second quarter, the increase was 3.5% from in the third Table 1:1 Quick Ratio (in millions) Company Cash Marketable Securities Accounts Receivable Quick Ratio Ford $14,272 520,904 S101.975 168 GM $15.238 58.163 58,337 1844 Industry 10.72 Based on these findings Ford Motor Company and General Motors are both safe short-term investment; the difference li in inventory values and prepaid assets. Capital Structure and Solvency A company's total debt to equity ratio gives the stockholder good idea of the risk they are going to make if looking to in According to the assigned text, the total debt to equity ratio equals all long-term debt plus all short-term debt, divided by stockholders' equity. "This ratio is a measure of solvency, indicating whether or not a company can generate sufficient to repay long term obligations." (Easton, 2020. ) Ford Motor Company and General Motors both hold more debt than cu Table 2.1: Total Debt to Equity Ratio (in millions) Company Long Term Debu Short Term Debe Stockholders Equity Total Debe to Fquity $120,731 S13,902 $28,637 GM 543.549 $19.562 $38.671 1.58 Industry Ford's debt to equity ratio is three times General Motors' rat and roughly 1.5 times that of the industry, suggesting the company relies more heavily on debt financing than most competitors. "Too much borrowing is risky in that borrowed money must be repaid with interest. The level of debt a com can effectively manage is directly related to the stability and reliability of its operating cash flows." (Easton, 2020.) Table 2.2: Operating vs. Non-Operating Return (in millions) Company ROERNOA Non-Operating Return Fond 2.55 Ford 278979% 19.8% GM 25 24 16.2919.09 Industry 24.914 Table 2.3: Debt to Assets Ratio (in millions) Company Total Art Debt to AEBIT interest Expense Ford 52249250.60 S11,0255773 GM S194,520 0:32 sx.161 5442 Table 2.4: EBITDA Coverage Ratio (in millions) Company Depreciation EBIT interest ExpenEBITDA Coverage Amortization Ratio Ford $7.993 $11,0255773 5. GM $8,017 58.161 443 3752 Table 2.5: Liabilities to Equity Ratio (in millions) Company Total Liabilities Sockholders Equity Liabilities to Equity Ratio Ford $196,174 $28,657 6,65% GM $154.197 29.871 Asset Utilization According to the assigned text, Asset Utilization analyzes th company's revenues in relation to their dollar assets. In orde compute Net Operating Asset Turnover (NOAT) we divide til company's sales with their average Net Ford Valuation, 4 Operating Assets. Asset utilization exemplifies how much a company is taking advantage of its assets in order to produce more sales. If a company has a NOAT of 1.0, then every doll earned is a result of a single dollar of an asset. Hence, a high NOAT being desired. GM has a much higher NOAT of 2.50 opposed to Ford having a 1.25 NOAT. This forecasts that Fo will not see as high a return on their assets as GM. Table 3.1: Net Operating Asset Turnover (in millions) Company Sales Average NOA NOAT $8.094 $10,0015 Ford GM $47/007845,4295 10.81 1.03 Profitability Profitability can be determined through an analysis of profit margin, return on net operating assets, and return on equity. According to the assigned text, Profit margin is calculated by dividing Net Operating Profit after Taxes (NOPAT) by Sales Return on Net Operating Assets (RNOA) is calculated by dividing NOPAT by the Average Net Operating Assets. As anticipated with the NOAT ratio, GM has a bigger RNOA th Ford, suggesting that they are efficient in their asset utilizati Table 4.1: Profit Margin, RNOA and ROE Company NOPAT Profit MariRNOAROE 17.9% 27.80 1629.252 Industry 60% According to the assigned reading. Return on Equity is calculated by dividing net income by average equity and is combination of the return on both operating and non-operati activities. A higher ROE indicates high growth within a company. Ford shows a 2.9% higher ROE than the industry 2.6% higher than GM, indicating that Ford is using its shareholder's money to generate more profit. Ford GM $9.469 3% 59.835 6.5% Week 5 9/27/-10/3/21 Determinants of security value include company profitability, operating growth, and risk. The first determinant was covered in Step 1. In Step 2 we complete our analysis with: (a) cost of capital (debt, equity, weighted) and (b)growth forecast using internal measurements and external data from industry, and macroeconomic analysis. Similar to Step One, this step will require some research along with calculations. Remember to use the resources provided in the Library Research Guide on your Ulearn site. Be sure to show all work completed by you and necessary to forecast your company's growth and cost of capital. When Step Two is completed, you will have demonstrated a thorough analysis of the risk and expected growth of your target company. A sample for each part of this step is provided here as a guide. You of course will need to use a different company for your project. Finally, to receive proper credit for your submission be sure to include both in-text citations and complete reference page. A sample from a prior class is attached here for guidance. Remember the company used in the sample may not be used by you for your submission. Please review the 10K Project Rubric (docx) for details about how you will be graded. (a) Sample Cost of Capital Calculations (Using Disney) COST OF CAPITAL: ($ in millions) Cost of Debt Capital Rd - Pretax borrowing rate for debt * -Tax rate) Rd -1.9%* (1-11.3%) - 1.69% Disney paid on 1.9% borrowing rate on the cost of 1.69%. The cost is considerably high due to low tax subsidy from the government (11.3%). The decrease in the effective income tax rate was due to the impact of the Tax Act (The Walt Disney Company Inc. 10-K, 2018) Tax rate Tax expense /Net income before taxes = 1.663/14,729 11.3% Borrowing rate Interest expense Average amount of interest-bearing debt 574/30.225 -1.9% (The Walt Disney Company Inc. 10-k. 2018) Cost of Equity Capital Re-Rf+[B(Rm - RJ Re-1.82% +10,97 * (10% - 1.82%) 11.32% This number implies that an investor requires an expected return of 11.32% to invest in Walt Disney's stock. This high expectation might be caused by the Disney's S-year beta or 0.97 which indicates that the company rises and falls in direct relationship to the movement of the market. 8 -0.97. (Yahoo Finance, 2019) Rf (return of the risk-free rate) - 1.82% (Fed 10 years treasury Bond as of 11/14/19) Rm (market return) - 10% (SP 500 10-year yield of return) Weighted Average Cost of Capital Rw Rd (IV/IVT + Re (IV/IVO - Rw=1169% (28.240/246,393)] + [11.32% (218,153 246,393)] +0.19% + 10.02% - 10.21% Walt Disney generated higher returns on investment (10.21%) than it costs the company to raise the capital needed for that investment. It camed excess retums. IVd - 28,240 million (10-K) Ie 218,153 million (1.507 billion outstanding shares x $144.76) (10-K) IVF-246,393 million (218,153 +28.240) (b) Sample Growth Forecast (Using Disney) GROWTH FORECAST: 2016 2015 2056 2017 2017 RUSLAN 542 55.5243 SDM 7950 R15 GOP 2392 24 25 26 BEA HER 0.750 22 25 Macroeconomic conditions: According to 2018 volume, issue 2 of OECD Economic Outlook, USA growth was projected to slow in the following two years as macroeconomic policy becomes less supportive While employment growth slows, consumption growth remains solid, supported by wage growth picking up as the labor market tightens further. They also projected that strong business investments in 2019 and 2020 would be supported by the tax reforms and supportive financial conditions. A weaker global outlook and already introduced trade measures weigh on activity. On top of all these, incentives made from 2017 would still continue in 2018 and in 2019 would be a bit weakened but still would see the affects. Elevated asset prices as well as non- financial sector debts would raise macroprudential which in turn would raise the risk level of financial stability (OECD. United States). OECD Economic Outlook 2019 volume 2 reported, global growth and predictions have steadily deteriorated, due to persistent policy uncertainty and weak trade and investment flows in the past two years. They estimated global GDP growth would be down from the 3.5% rate projected in 2018 to be 29% in 2019, and project it to remain around 3% for 2020-21, which will be the weakest since the global financial crisis. While growth in Japan and the curo arca is expected to be around 0.7 and 1.2% respectively, China's growth will continue to edge down, to around 5.5% by 2021. USA GDP growth on the other hand, is expected to slow to 2% by 2021. Other emerging market economies are expected to recover only modestly Coupled with rising government support across a range of sectors, new trade restrictions have been implemented by G20 economies which induces disruptions in supply chains and reallocations of activities across countries that both exert a drag on current demand by reducing incentives to invest and undermine medium-term growth. (OECD, Multilingual Summaries). According to U.S Bureau of Economic Analysis, Real GDP increased 1.9% in the third quarter of 2019 while its was 2% in second quarter. On the other hand, while current dollar GDP increased 4.7 percent on second quarter, the increase was 3.5% from in the third Table 1:1 Quick Ratio (in millions) Company Cash Marketable Securities Accounts Receivable Quick Ratio Ford $14,272 520,904 S101.975 168 GM $15.238 58.163 58,337 1844 Industry 10.72 Based on these findings Ford Motor Company and General Motors are both safe short-term investment; the difference li in inventory values and prepaid assets. Capital Structure and Solvency A company's total debt to equity ratio gives the stockholder good idea of the risk they are going to make if looking to in According to the assigned text, the total debt to equity ratio equals all long-term debt plus all short-term debt, divided by stockholders' equity. "This ratio is a measure of solvency, indicating whether or not a company can generate sufficient to repay long term obligations." (Easton, 2020. ) Ford Motor Company and General Motors both hold more debt than cu Table 2.1: Total Debt to Equity Ratio (in millions) Company Long Term Debu Short Term Debe Stockholders Equity Total Debe to Fquity $120,731 S13,902 $28,637 GM 543.549 $19.562 $38.671 1.58 Industry Ford's debt to equity ratio is three times General Motors' rat and roughly 1.5 times that of the industry, suggesting the company relies more heavily on debt financing than most competitors. "Too much borrowing is risky in that borrowed money must be repaid with interest. The level of debt a com can effectively manage is directly related to the stability and reliability of its operating cash flows." (Easton, 2020.) Table 2.2: Operating vs. Non-Operating Return (in millions) Company ROERNOA Non-Operating Return Fond 2.55 Ford 278979% 19.8% GM 25 24 16.2919.09 Industry 24.914 Table 2.3: Debt to Assets Ratio (in millions) Company Total Art Debt to AEBIT interest Expense Ford 52249250.60 S11,0255773 GM S194,520 0:32 sx.161 5442 Table 2.4: EBITDA Coverage Ratio (in millions) Company Depreciation EBIT interest ExpenEBITDA Coverage Amortization Ratio Ford $7.993 $11,0255773 5. GM $8,017 58.161 443 3752 Table 2.5: Liabilities to Equity Ratio (in millions) Company Total Liabilities Sockholders Equity Liabilities to Equity Ratio Ford $196,174 $28,657 6,65% GM $154.197 29.871 Asset Utilization According to the assigned text, Asset Utilization analyzes th company's revenues in relation to their dollar assets. In orde compute Net Operating Asset Turnover (NOAT) we divide til company's sales with their average Net Ford Valuation, 4 Operating Assets. Asset utilization exemplifies how much a company is taking advantage of its assets in order to produce more sales. If a company has a NOAT of 1.0, then every doll earned is a result of a single dollar of an asset. Hence, a high NOAT being desired. GM has a much higher NOAT of 2.50 opposed to Ford having a 1.25 NOAT. This forecasts that Fo will not see as high a return on their assets as GM. Table 3.1: Net Operating Asset Turnover (in millions) Company Sales Average NOA NOAT $8.094 $10,0015 Ford GM $47/007845,4295 10.81 1.03 Profitability Profitability can be determined through an analysis of profit margin, return on net operating assets, and return on equity. According to the assigned text, Profit margin is calculated by dividing Net Operating Profit after Taxes (NOPAT) by Sales Return on Net Operating Assets (RNOA) is calculated by dividing NOPAT by the Average Net Operating Assets. As anticipated with the NOAT ratio, GM has a bigger RNOA th Ford, suggesting that they are efficient in their asset utilizati Table 4.1: Profit Margin, RNOA and ROE Company NOPAT Profit MariRNOAROE 17.9% 27.80 1629.252 Industry 60% According to the assigned reading. Return on Equity is calculated by dividing net income by average equity and is combination of the return on both operating and non-operati activities. A higher ROE indicates high growth within a company. Ford shows a 2.9% higher ROE than the industry 2.6% higher than GM, indicating that Ford is using its shareholder's money to generate more profit. Ford GM $9.469 3% 59.835 6.5%
