Answered step by step
Verified Expert Solution
Question
1 Approved Answer
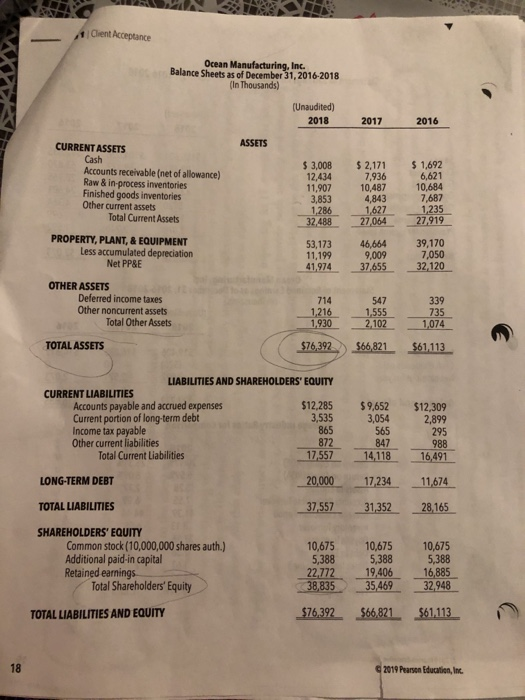
I need cash flow statement. cash flow statement indirect methods. Client Acceptance Ocean Manufacturing, Inc. Balance Sheets as of December 31, 2016-2018 (In Thousands) (Unaudited)


I need cash flow statement.
cash flow statement indirect methods.
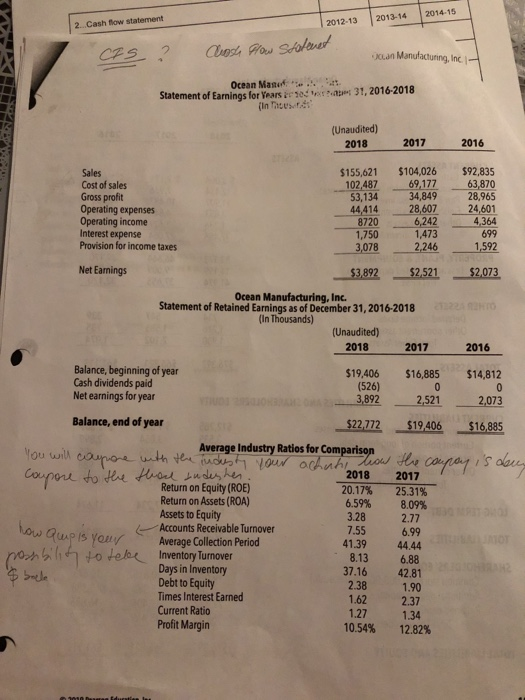
Client Acceptance Ocean Manufacturing, Inc. Balance Sheets as of December 31, 2016-2018 (In Thousands) (Unaudited) 2018 2017 2016 ASSETS CURRENT ASSETS Cash Accounts receivable (net of allowance) Raw & in-process inventories Finished goods inventories Other current assets Total Current Assets $ 3,008 12,434 11,907 3,853 1,286 32,488 $ 2,171 7,936 10,487 4,843 1,627 27064 $ 1,692 6,621 10,684 7,687 1,235 27.919 PROPERTY, PLANT, & EQUIPMENT Less accumulated depreciation Net PP&E 53,173 11,199 41,974 46,664 9,009 37,655 39,170 7,050 32,120 OTHER ASSETS Deferred income taxes Other noncurrent assets Total Other Assets 714 1.216 1,930 547 1,555 2,102 339 735 1,074 TOTAL ASSETS $76,392 $66,821 $61,113 LIABILITIES AND SHAREHOLDERS' EQUITY CURRENT LIABILITIES Accounts payable and accrued expenses $12,285 Current portion of long-term debt 3,535 Income tax payable 865 Other current liabilities 872 Total Current Liabilities 17557 $ 9,652 3,054 565 847 14.118 $12,309 2,899 295 988 16,491 LONG-TERM DEBT 20,000 17,234 11674 TOTAL LIABILITIES 37,557 31,352 28,165 SHAREHOLDERS' EQUITY Common stock (10,000,000 shares auth.) Additional paid-in capital Retained earnings Total Shareholders' Equity 10,675 5,388 22,772 38,835 10,675 5,388 19,406 35,469 10,675 5,388 16,885 32.948 TOTAL LIABILITIES AND EQUITY $76,392 $66,821 $61.113 18 2019 Pearson Education, Inc. 2014-15 2012-13 2013-14 2...Cash flow statement CFS ? Clash flow statemet Kun Manufacturing, Inc Ocean Mames. Statement of Earnings for years or so ist 31, 2016-2018 (Unaudited) 2018 2017 2016 Sales Cost of sales Gross profit Operating expenses Operating income Interest expense Provision for income taxes $155,621 102,487 53,134 44,414 8720 1,750 3,078 $104,026 69,177 34,849 28,607 6,242 1,473 2,246 $92,835 63,870 28,965 24,601 4,364 699 1,592 Net Earnings $3,892 $2,521 $2,073 1222 Ocean Manufacturing, Inc. Statement of Retained Earnings as of December 31, 2016-2018 (In Thousands) (Unaudited) 2018 2017 2016 Balance, beginning of year Cash dividends paid Net earnings for year Balance, end of year $19,406 (526) 3,892 $16,885 0 2,521 $14,812 0 2,073 $22,772 $19.406 $16,885 Average Industry Ratios for Comparison ow the compari's dever You will capore with the industy your achating coupore to the thod sudesher Return on Equity (ROE) Return on Assets (ROA) Assets to Equity Accounts Receivable Turnover Average Collection Period how Quip is your ponbilan to tebe Inventory turnover & boeke 2018 20.17% 6.59% 3.28 7.55 41.39 8.13 37.16 2.38 1.62 1.27 10.54% 2017 25.31% 8.09% 2.77 6.99 44.44 6.88 42.81 1.90 2.37 1.34 12.82% Days in Inventory Debt to Equity Times Interest Earned Current Ratio Profit MarginStep by Step Solution
There are 3 Steps involved in it
Step: 1

Get Instant Access to Expert-Tailored Solutions
See step-by-step solutions with expert insights and AI powered tools for academic success
Step: 2

Step: 3

Ace Your Homework with AI
Get the answers you need in no time with our AI-driven, step-by-step assistance
Get Started


