

Answered step by step
Verified Expert Solution
Question
1 Approved Answer
I need full answer of this question by using Excel Handwriting is not allowed Answer all from a to h Q. (100 points) In 2020
I need full answer of this question by using Excel
Handwriting is not allowed
Answer all from a to h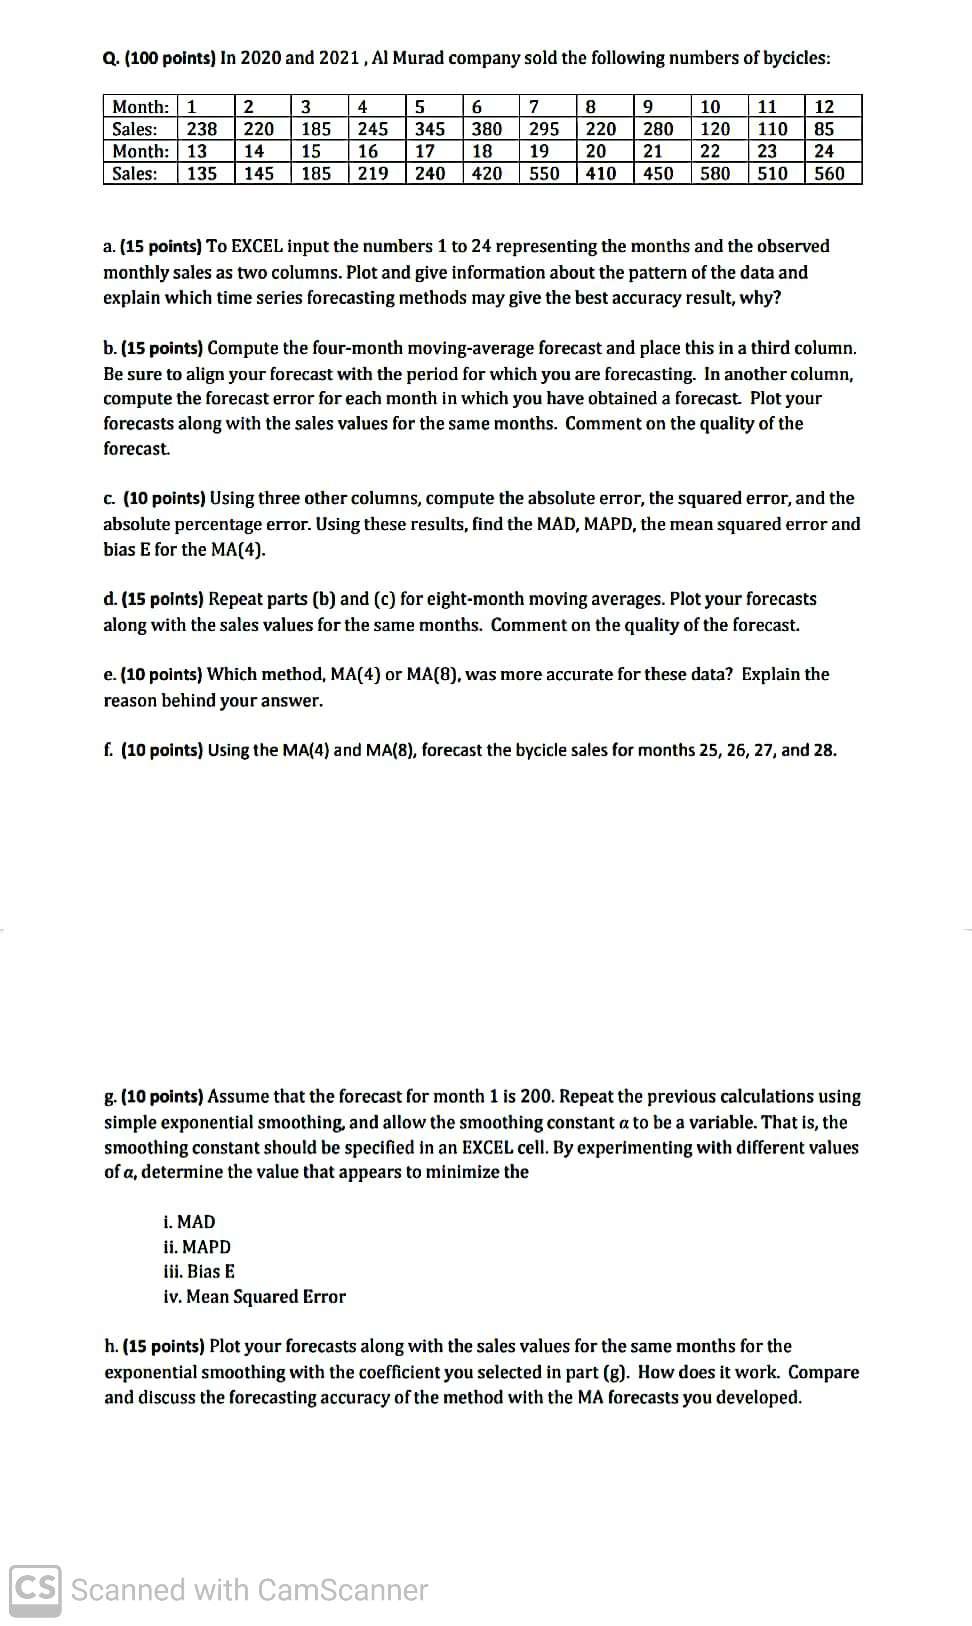
Q. (100 points) In 2020 and 2021, Al Murad company sold the following numbers of bycicles: 2 3 4 5 7 9 Month: 1 Sales: 238 6 380 295 220 185 245 345 10 11 12 280 120 110 85 21 22 23 24 560 Month: 13 14 15 16 17 18 19 Sales: 135 145 185 219 240 420 550 450 580 510 a. (15 points) To EXCEL input the numbers 1 to 24 representing the months and the observed monthly sales as two columns. Plot and give information about the pattern of the data and explain which time series forecasting methods may give the best accuracy result, why? 8 220 20 410 b. (15 points) Compute the four-month moving-average forecast and place this in a third column. Be sure to align your forecast with the period for which you are forecasting. In another column, compute the forecast error for each month in which you have obtained a forecast. Plot your forecasts along with the sales values for the same months. Comment on the quality of the forecast. c. (10 points) Using three other columns, compute the absolute error, the squared error, and the absolute percentage error. Using these results, find the MAD, MAPD, the mean squared error and bias E for the MA(4). d. (15 points) Repeat parts (b) and (c) for eight-month moving averages. Plot your forecasts along with the sales values for the same months. Comment on the quality of the forecast. e. (10 points) Which method, MA(4) or MA(8), was more accurate for these data? Explain the reason behind your answer. f. (10 points) Using the MA(4) and MA(8), forecast the bycicle sales for months 25, 26, 27, and 28. g. (10 points) Assume that the forecast for month 1 is 200. Repeat the previous calculations using simple exponential smoothing, and allow the smoothing constant a to be a variable. That is, the smoothing constant should be specified in an EXCEL cell. By experimenting with different values of a, determine the value that appears to minimize the i. MAD ii. MAPD iii. Bias E iv. Mean Squared Error h. (15 points) Plot your forecasts along with the sales values for the same months for the exponential smoothing with the coefficient you selected in part (g). How does it work. Compare and discuss the forecasting accuracy of the method with the MA forecasts you developed. CS Scanned with CamScanner Q. (100 points) In 2020 and 2021, Al Murad company sold the following numbers of bycicles: 2 3 4 5 7 9 Month: 1 Sales: 238 6 380 295 220 185 245 345 10 11 12 280 120 110 85 21 22 23 24 560 Month: 13 14 15 16 17 18 19 Sales: 135 145 185 219 240 420 550 450 580 510 a. (15 points) To EXCEL input the numbers 1 to 24 representing the months and the observed monthly sales as two columns. Plot and give information about the pattern of the data and explain which time series forecasting methods may give the best accuracy result, why? 8 220 20 410 b. (15 points) Compute the four-month moving-average forecast and place this in a third column. Be sure to align your forecast with the period for which you are forecasting. In another column, compute the forecast error for each month in which you have obtained a forecast. Plot your forecasts along with the sales values for the same months. Comment on the quality of the forecast. c. (10 points) Using three other columns, compute the absolute error, the squared error, and the absolute percentage error. Using these results, find the MAD, MAPD, the mean squared error and bias E for the MA(4). d. (15 points) Repeat parts (b) and (c) for eight-month moving averages. Plot your forecasts along with the sales values for the same months. Comment on the quality of the forecast. e. (10 points) Which method, MA(4) or MA(8), was more accurate for these data? Explain the reason behind your answer. f. (10 points) Using the MA(4) and MA(8), forecast the bycicle sales for months 25, 26, 27, and 28. g. (10 points) Assume that the forecast for month 1 is 200. Repeat the previous calculations using simple exponential smoothing, and allow the smoothing constant a to be a variable. That is, the smoothing constant should be specified in an EXCEL cell. By experimenting with different values of a, determine the value that appears to minimize the i. MAD ii. MAPD iii. Bias E iv. Mean Squared Error h. (15 points) Plot your forecasts along with the sales values for the same months for the exponential smoothing with the coefficient you selected in part (g). How does it work. Compare and discuss the forecasting accuracy of the method with the MA forecasts you developed. CS Scanned with CamScanner
Step by Step Solution
There are 3 Steps involved in it
Step: 1

Get Instant Access to Expert-Tailored Solutions
See step-by-step solutions with expert insights and AI powered tools for academic success
Step: 2

Step: 3
Ace Your Homework with AI
Get the answers you need in no time with our AI-driven, step-by-step assistance
Get Started
This Dad Sells Real Estate Got Referrals
Authors: Be Mi Real Estate Store
1st Edition
B0BW267J4G