i need help analyizing the data for what the numbers mean. it is Macys vs Norstrom. the numbers are provided and the ratio names. thanks!
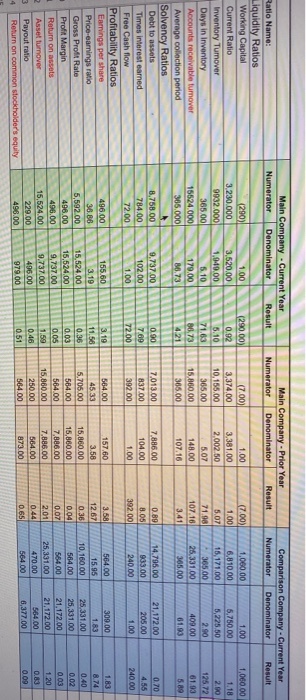
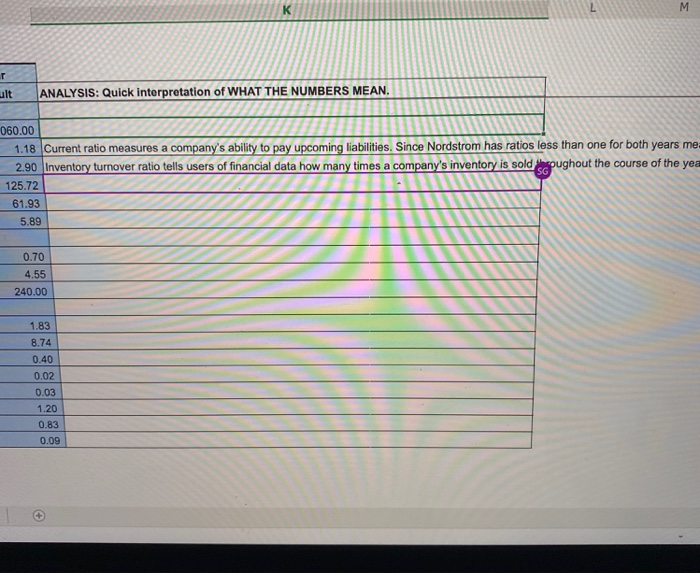
Main Company - Current Year Numerator Denominator Result Main Company - Prior Year Numerator Denominator Result Comparison Company - Current Year Numerator Denominator Result (290) 3,230.000 9932.000 365.00 15524.000 365.000 1.00 3,520,00 1.940.00 5.10 179.00 86.73 (290.00) 0.92 5.10 71.63 86,73 421 (7.00) 3,374.00 10.155.00 365.00 15.860.00 365.00 1.00 3,381,00 2.002.50 507 148.00 107.10 (7.00) 1.00 5.07 71.98 107.16 3.41 1,000.00 6,810.00 15,171,00 365.00 25, 33100 365.00 1.00 5.750,00 5,225.50 2.90 409.00 61,03 1,060.00 1.18 2.80 125.72 61.93 5.89 Ratio Name: Liquidity Ratios Working Capital Current Ratio Inventory Turnover Days in Inventory Accounts receivable turnover Average collection period Solvency Ratios Debt to assets Times interest earned Free Cash flow Profitability Ratios Earnings per share Price-camnings ratio Gross Profit Rate Profit Margin Return on assets Asset turnover Payout ratio 4 Return on common stockholder's equity 8.758.00 784.00 72.00 9.737.00 102.00 1.00 0.90 7.69 72.00 7.013.00 837.00 392 00 7.886.00 104.00 1.00 0.89 8.05 392.00 14.705.00 933.00 240.00 21,172.00 205.00 1.00 0.70 4.56 240.00 496.00 36.86 5,592 00 496.00 496.00 15,524.00 229.00 496.00 155.60 3.10 15.524.00 15,524,00 9,737.00 9.737.00 496.00 979.00 3.10 11.50 0.36 0.00 0.05 1.59 0.46 0.51 564.00 45 33 5.706.00 564.00 564.00 15,860.00 250.00 564.00 157.60 3.58 15,860.00 15,860.00 7,886.00 7.886.00 564.00 873.00 3.58 12.67 0.36 0.04 0.07 2.01 0.44 0.65 564.00 15.95 10.160.00 564.00 564.00 25,331.00 470.00 564 00 309.00 1.83 25.331.00 25,331.00 21.172.00 21,172.00 564.00 6,377.00 1.83 8.74 0.40 0.02 0.03 1.20 0.83 0.09 M alt ANALYSIS: Quick interpretation of WHAT THE NUMBERS MEAN. 060.00 1.18 Current ratio measures a company's ability to pay upcoming liabilities. Since Nordstrom has ratios less than one for both years me 2.90 Inventory turnover ratio tells users of financial data how many times a company's inventory is sold oughout the course of the yea 125.72 61.93 5.89 0.70 4.55 240.00 1.83 8.74 0.40 0.02 0.03 1.20 0.83 0.09