i need help doing the intervals problems I'm confuse doing this problems i have some example below
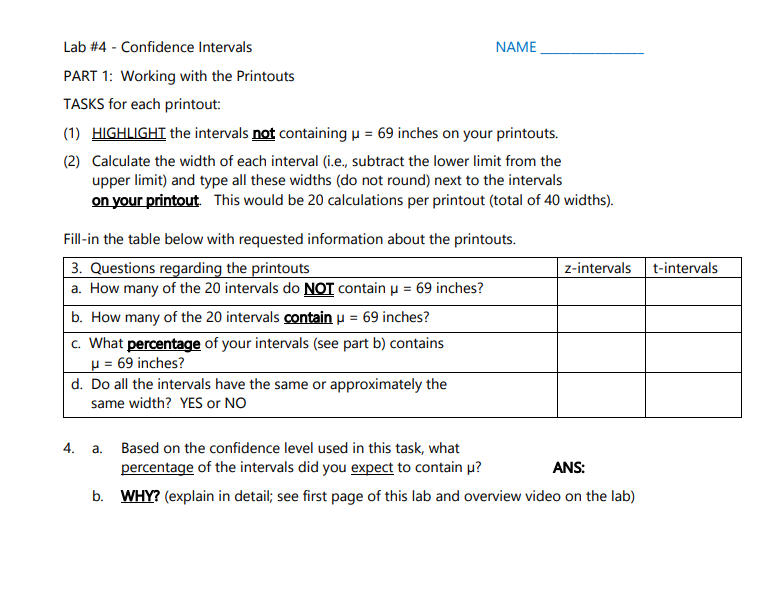
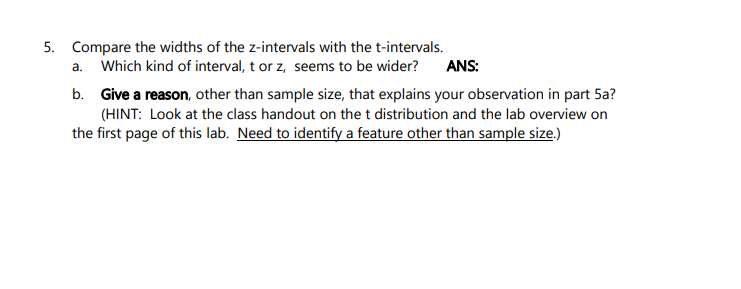
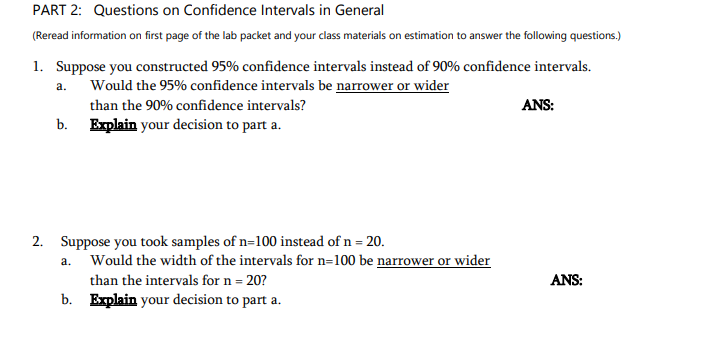
Lab #4 - {Confidence Intervals NAME PART 1: Working with the Printouts TASKS for each printout: {1) HIEHJJGHI the intervals containing p = 69 inches on your printouts. [2) Calculate the width of each interval {i.e.. subtract the lower limit from the upper limit) and type all these widths {do not round] next to the intervals W This would be 2D calculations per printout {total of 4d widths]. Fill-in the table below with requested information about the printouts. 3. Questions ---ardin the urintouts m t-intervals a. How many of the 2D intervals do HIE contain p = 59 inches? -_ b. How many of the 2d intervals mm H = as inches? -_ -- u = 69 inches? d. Do all the intervals have the same or approximately the -- 4. a. Based on the condence level used in this task. what percentage of the intervals did you evp_ect to contain p? ANS: b. E? {explain in detail; see rst page of this lab and overview video on the lab) Compare the widths of the z-intenrals with the t-intenrals. a. Which kind of interval. t orz. seems to be wider? ANS: h. Even reason. other than sample size. that explains your observation in part 5a? (HINT: Look at the class handout on the t distribution and the lab overview on the first page of this lab. Need to identi a feature other than sarn Ie size.) PART 2: Questions on Confidence Intervals in General (Reread information on first page of the lab packet and your class materials on estimation to answer the following questions.) 1. Suppose you constructed 95% confidence intervals instead of 90% confidence intervals. a. Would the 95% confidence intervals be narrower or wider than the 90% confidence intervals? ANS: b. Explain your decision to part a. 2. Suppose you took samples of n=100 instead of n = 20. a. Would the width of the intervals for n=100 be narrower or wider than the intervals for n = 20? ANS: b. Explain your decision to part a.3. Suppose you constructed 90% confidence intervals for a p using 20 sets of real data. Remember that for the two printouts used in this lab--z confidence intervals and t confidence intervals--MINITAB is simulating what confidence intervals do to illustrate the accuracy of the estimating. The reason we construct confidence intervals for p is to estimate p; therefore when working with real data (NOT a simulation like in this lab printouts) to construct confidence intervals for H, H's value is unknown. a. i. About how many (looking for a physical count) of these 20 intervals would you expect to contain p if you construct 90% confidence intervals? ANS: ii. WHY? Your explanation needs to include (1) calculation to determine count and (2) an explanation of what a confidence level indicates. b. i. Could you tell which of these 20 intervals did and which intervals did not contain p? Yes or NO ANS: ii. Why or why not