

Question
Part 1 1) I need to choose one appropriate statistical test such as (Independent Sample Test or One way ANOVA etc anything works) that is
Part 1
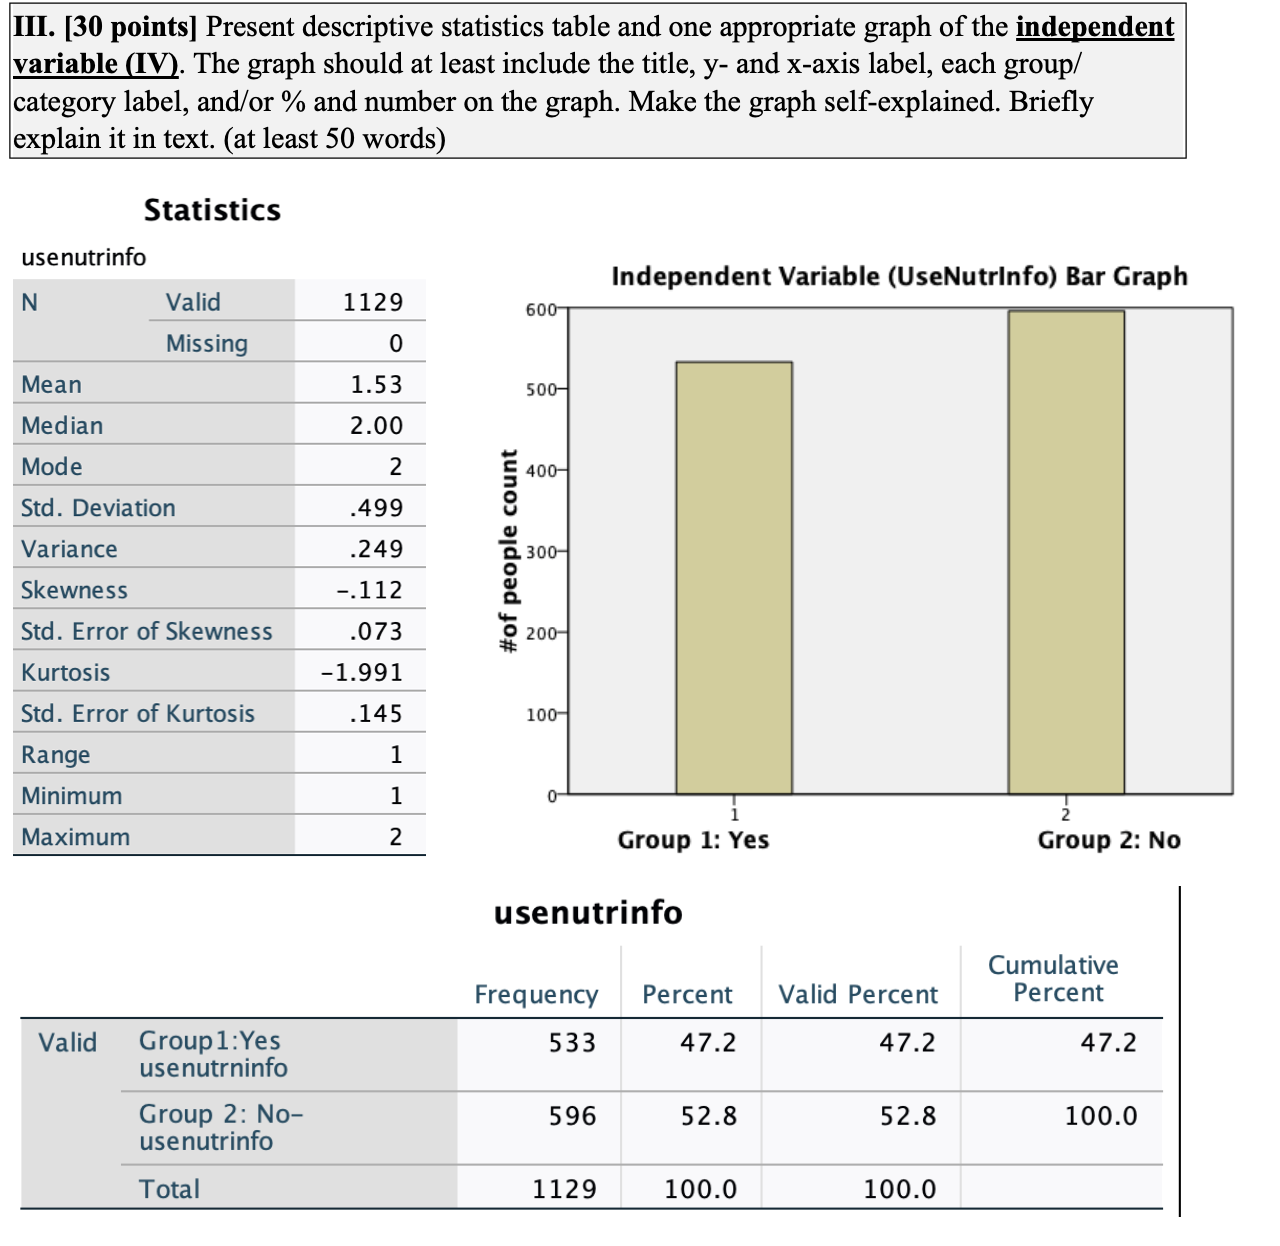
1) I need to choose one appropriate statistical test such as (Independent Sample Test or One way ANOVA etc anything works) that is based on the level of measurement of DV(BMI) and IV (Group 1,2) . I don't know what statistical test I should choose.
(2) Then, there needs to be a brief explanation of reason why the specific test was chosen.
(3) Last, I need to state the null (H0) and alternative (H) hypotheses of the test,
4) Show all the relevant SPSS output tables.
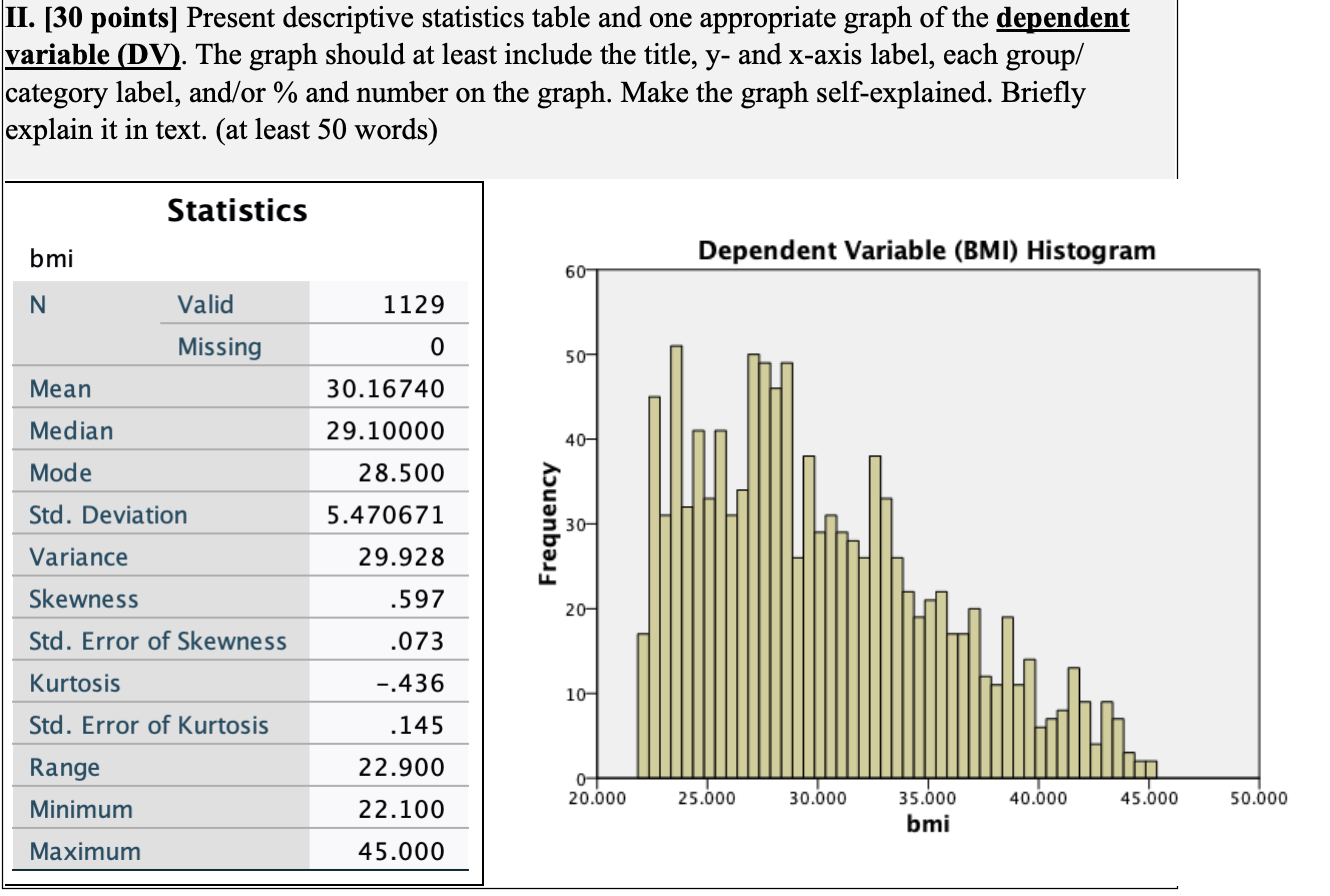
Part 2: I need to answer questions based on the tables and graphs below.
(1) how many total valid observations are in the sample?
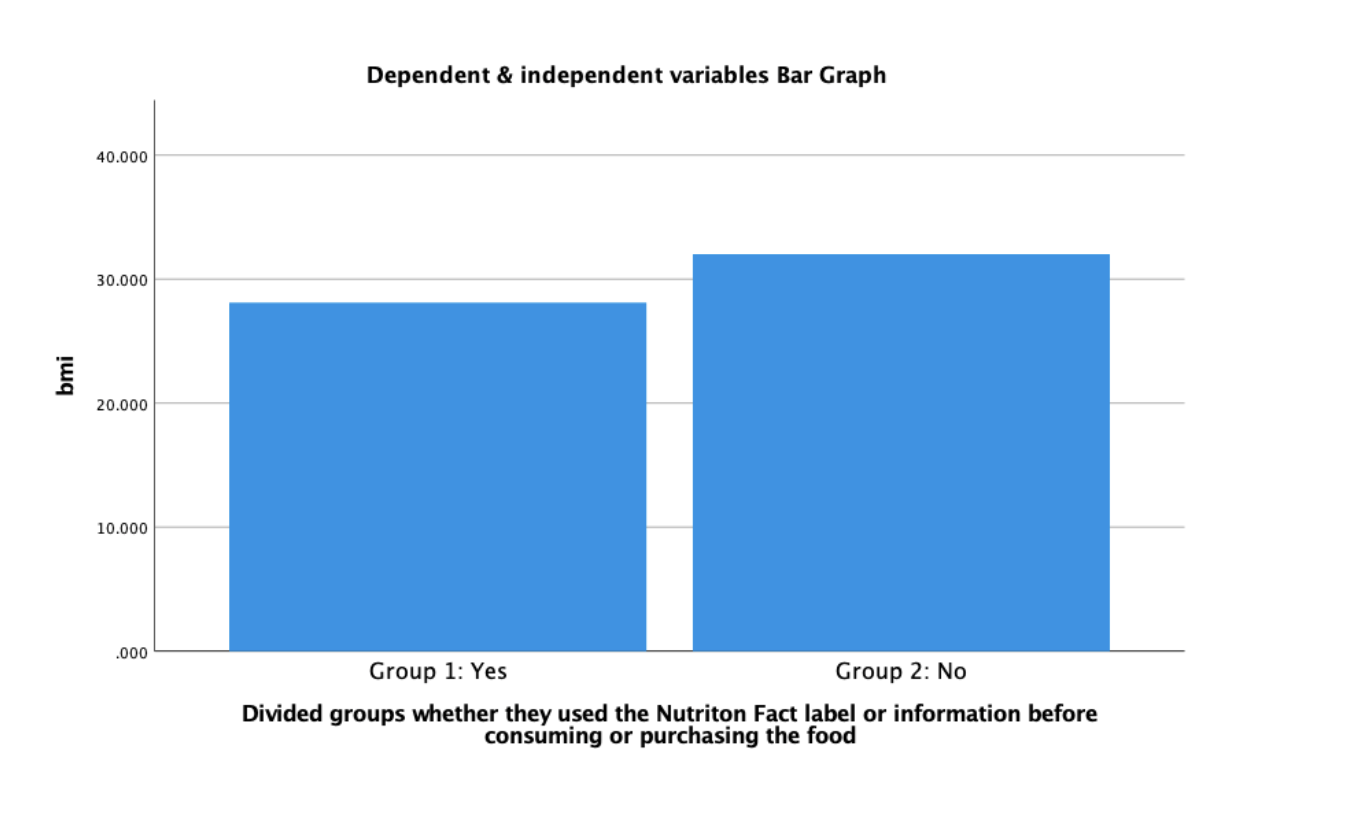
(2) what is the average mean of each group, number of people in each group,
(3) what is the test statistics value?, what is the p-value? etc. Explaining the statistical results.
Step by Step Solution
There are 3 Steps involved in it
Step: 1

Get Instant Access to Expert-Tailored Solutions
See step-by-step solutions with expert insights and AI powered tools for academic success
Step: 2

Step: 3
Ace Your Homework with AI
Get the answers you need in no time with our AI-driven, step-by-step assistance
Get Started
Algebra And Trigonometry Enhanced With Graphing Utilities (Subscription)
Authors: Michael, Michael Sullivan III, Michael III Sullivan, Michael Sullivan 111, III Sullivan
6th Edition
0321849132, 9780321849137