Answered step by step
Verified Expert Solution
Question
1 Approved Answer
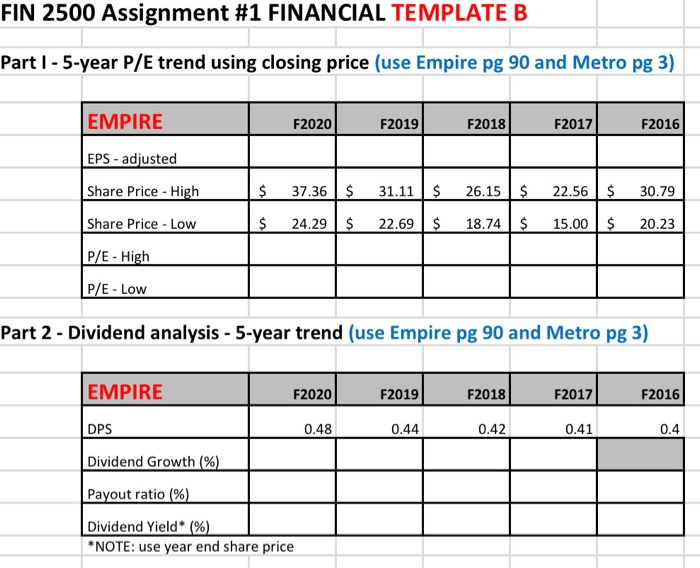
I need help filling out the following chart using the information provided in the financial review. Thanks! FIN 2500 Assignment #1 FINANCIAL TEMPLATE B Part
I need help filling out the following chart using the information provided in the financial review. Thanks! 


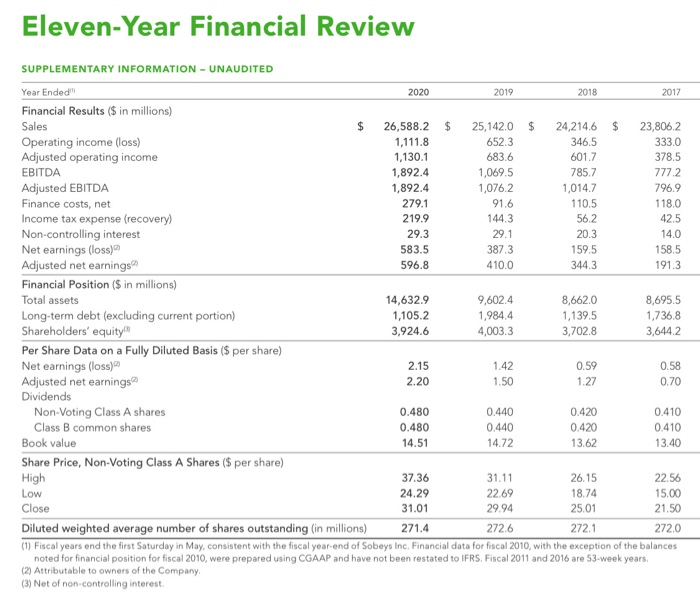
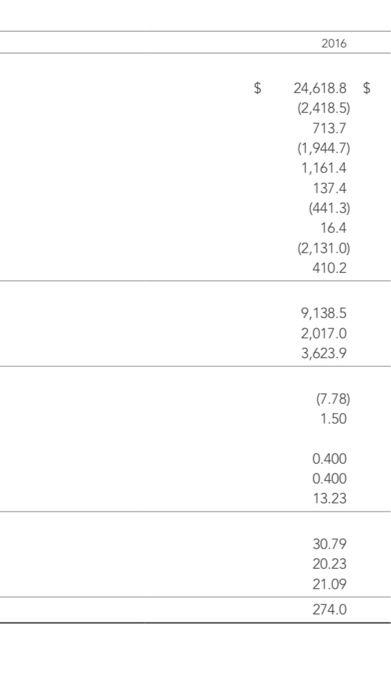
FIN 2500 Assignment #1 FINANCIAL TEMPLATE B Part 1 - 5-year P/E trend using closing price (use Empire pg 90 and Metro pg 3) EMPIRE F2020 F2019 F2018 F2017 F2016 EPS - adjusted Share Price - High Share Price - Low $ 37.36 $ 31.11 $ 26.15$ 22.56 $ 30.79 $ 24.29 $ 22.69 $ 18.74 $ 15.00 $ 20.23 P/E - High P/E - Low Part 2 - Dividend analysis - 5-year trend (use Empire pg 90 and Metro pg 3) EMPIRE F2020 F2019 F2018 F2017 F2016 DPS 0.48 0.44 0.42 0.41 0.4 Dividend Growth (%) Payout ratio (%) Dividend Yield* (%) *NOTE: use year end share price Eleven-Year Financial Review SUPPLEMENTARY INFORMATION - UNAUDITED Year Ended" 2020 2019 2018 2017 Financial Results ($ in millions) Sales $ 26,588.2 $ 25,142.0 $ 24,214.6 $ 23,806.2 Operating income (loss) 1,111.8 652.3 346.5 333.0 Adjusted operating income 1,130.1 683.6 601.7 378.5 EBITDA 1,892.4 1,069.5 785.7 777.2 Adjusted EBITDA 1,892.4 1,076.2 1,014.7 796.9 Finance costs, net 279.1 91.6 110.5 118.0 Income tax expense (recovery) 219.9 144.3 56.2 42.5 Non-controlling interest 29.3 29.1 20.3 14.0 Net earnings (loss) 583.5 387.3 159.5 158.5 Adjusted net earnings 596.8 410.0 344.3 191.3 Financial Position (5 in millions) Total assets 14,632.9 9,602.4 8,662.0 8,695.5 Long-term debt (excluding current portion) 1,105.2 1,984.4 1,139.5 1,736.8 Shareholders' equity 3,924.6 4,003.3 3,702.8 3,644.2 Per Share Data on a Fully Diluted Basis ($ per share) Net earnings (loss) 2.15 1.42 0.59 0.58 Adjusted net earnings 2.20 1.50 1.27 0.70 Dividends Non-Voting Class A shares 0.480 0.440 0.420 0.410 Class B common shares 0.480 0.440 0.420 0.410 Book value 14.51 14.72 13.62 13.40 Share Price, Non-Voting Class A Shares ($ per share) High 37.36 31.11 26.15 22.56 Low 24.29 22.69 18.74 15.00 Close 31.01 29.94 25.01 21.50 Diluted weighted average number of shares outstanding (in millions) 271.4 272.6 2721 272.0 (1) Fiscal years end the first Saturday in May, consistent with the fiscal year-end of Sobeys Inc. Financial data for fiscal 2010, with the exception of the balances noted for financial position for fiscal 2010, were prepared using CGAAP and have not been restated to IFRS. Fiscal 2011 and 2016 are 53-week years. (2) Attributable to owners of the Company (3) Net of non-controlling interest 2016 $ 24.618.8 $ (2.418.5) 713.7 (1.944.7) 1.161.4 137.4 (441.3) 16.4 (2131.0) 410.2 9.138.5 2017.0 3.623.9 7.78) 1.50 0.400 0.400 13.23 30.79 20.23 21.09 274.0 


Step by Step Solution
There are 3 Steps involved in it
Step: 1

Get Instant Access to Expert-Tailored Solutions
See step-by-step solutions with expert insights and AI powered tools for academic success
Step: 2

Step: 3

Ace Your Homework with AI
Get the answers you need in no time with our AI-driven, step-by-step assistance
Get Started


