

Answered step by step
Verified Expert Solution
Question
1 Approved Answer
I need help finding the highlighted cells which is the CAPEX. I have attached the income statement where the revenue info can be found. I'm
I need help finding the highlighted cells which is the CAPEX. I have attached the income statement where the revenue info can be found. I'm really confused on how to find it. I tried using the previous year as a reference to solve for 2013-2017 but it didn't work at all. 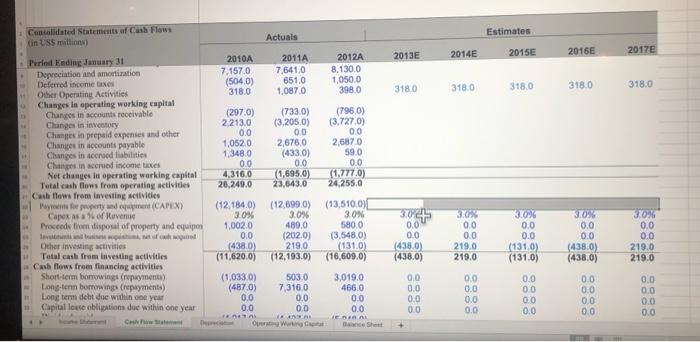
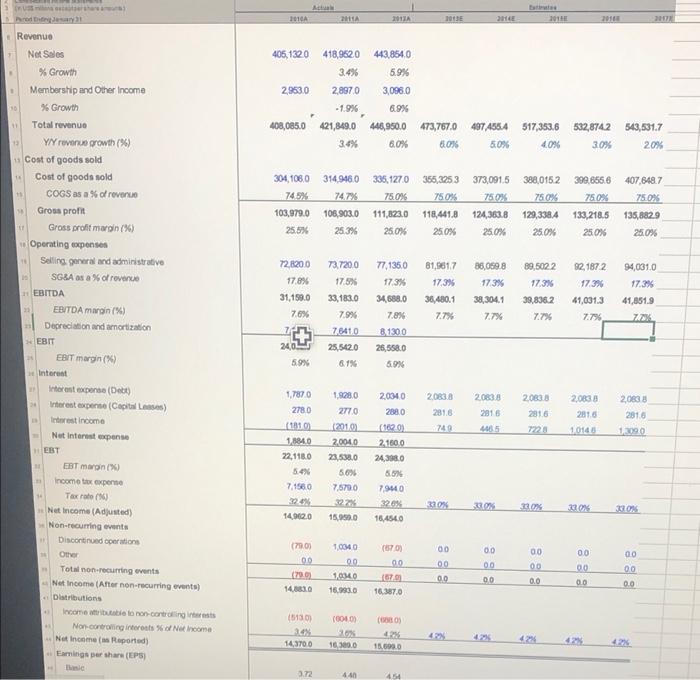
Estimates Consolidated Statements of Cash Flows in USS million Actuals 2013E 2014E 2015E 2016 2017E 2010A 7.157.0 (504.0) 3180 2011A 7,6410 651.0 1,0870 2012A 8.130.0 1,050,0 3980 3180 318.0 3180 318.0 318.0 (2970) 2.213.0 00 1,0520 1,3480 0.0 4,316,0 26.249.0 Perind Ending January 31 Depreciation and amortization Deferred income taxes Other Operating Activities Changes in operating working capital Changes in accounts receivable Changes in investory Changes in prepaid expenses and other Changes in accounts payable Changes in accrued liabilities Changes in crued income taxes Net changes in operating working capital Total cash flows from operating activities Cash flows from investing activities went for property and went (CAPEX) Capex as of Revenue Proceeds from disposal of property and equipo Other investing activities Total cash from investing activities Cash flows from financing activities Short-term bomowings (rvpayment) Long-term borrowings (repayments) Long term det due within one year Capital loue obligations due within one year De (733.0) (3.205,0) 0.0 2,6760 (433.0) 0.0 (1,695.0) 23,643.0 (12,699.0) 3.0% 480.0 (202.0) 219.0 (12,193.0) (796.0) (3.7270) 0.0 2.6870 59.0 0.0 (1.777.0) 24.255.0 (12.184.0) 3.0% 1,002.0 0.0 (438.0) (11,620,0) (13,510,0) 3.0% 580.0 (3,548.0) 131.0) (16,609,0) 30 0.0 0.0 (438.0) (438.0) 30% 0.0 0.0 219.0 219.0 30% 0.0 0.0 (1310) (131.0) 370 0.0 0.0 (438.0) (438.0) 30% 0.0 0.0 219.0 219.0 (1.033.0) 503.0 (487.0) 7,316.0 0.0 0.0 0.0 0.0 En 3,019.0 466.0 0.0 0.0 RE She OOO OOO 0.0 0.0 0.0 0.0 0.0 0.0 0.0 0.0 0.0 00 0.0 0.0 0.0 0.0 0.0 OOOO OOOO 0.0 0.0 0.0 0.0 1 0.0 AN 1010 2 2011 2013 2014 301 Revenue 405, 1320 2,953.0 418,962.0 443.854.0 3.4% 5.9% 2,8970 3,096,0 -1.9% 6.9% 421,849,0 446,950.0 3.4% 6.0% 11 408,085.0 543,531.7 473,767.0 497.455.4 80% 5.0% 517,353.6 532,874.2 4.0% 30% 13 20% 1 Net Sales % Growth Membership and Other Income % Growth Total revenue Y revenue growth (%) Cost of goods sold Cost of goods sold COGS as a % of rever Gross pront Gross profit margin(96) Operating expenses Selling general and administrative SGBA as a % of revenue EBITDA EBITDA margin (%) Depreciation and amortization 335,1270 78.0% 11 304,106.0 314.9460 74.5% 747% 103,979.0 106.903.0 25.5% 25.3% 355,3253 75.0% 118.441.8 25.0% 373,0915 750X 124,363.8 25.0% 388,0152 390.6556 750% 75.0% 129,3384 133,218.5 25.0% 25.0% 407,648.7 75.02 135,8829 25.0% 111,823.0 25.0% 11 10 72.8200 17.8% 31,159.0 73.720.0 17.5% 33,183.0 7.9% 7641.0 25,5420 6.1% 81,861.7 17,3% 36,480.1 77% 77,135.0 17.3% 34,688.0 7.8% 81300 25,558.0 6.9% 36,059.8 17.3% 38,304.1 7.7% 89,5022 17.3% 39,8362 7.7% 92.1872 17.3% 41,031.3 7.795 22 94,031.0 17.3% 41,851.9 72X 7.6% EBIT 24.04 5.9% 2083.8 20838 281.6 2.0833 2016 7728 2,083 2816 10145 20833 2816 1,3090 749 4465 1.7870 2780 (1810 1884.0 22.118.0 5.4% 7.1560 1.9280 2770 12010 2,004,0 23,538.0 6.6% 7,6790 EBIT margin (0) Interest Interent perse (Dee) Interent experto (Capitale) Interest income Nut Interest expense HEBT EBT margin Income tax expenne ** Tax rate (M) Net Income (Adjusted) Non recurring events Discontinued operations Other Total non-recurring events -Net Income Aftor non-recurring events) Distributions Income attribute to non-controlling Non controlling interests of income - Not Income Reported) Earnings per shars (EPS) 20340 288.0 102.0 2,100.0 24,3980 65% 7,940 3201 16,4540 300% 30 22.07% 14.962,0 15,050.0 00 0.0 00 00 (73.03 00 (700 14.30 1.0040 00 1,0340 16.993.0 67) 00 6792 163870 00 00 00 00 00 OD 00 0.0 00 0.0 0.0 (5130 (004 (0) 4 42 14 3700 16,300.0 15.690.0 42 3.72 440 454 Step by Step Solution
There are 3 Steps involved in it
Step: 1

Get Instant Access to Expert-Tailored Solutions
See step-by-step solutions with expert insights and AI powered tools for academic success
Step: 2

Step: 3
Ace Your Homework with AI
Get the answers you need in no time with our AI-driven, step-by-step assistance
Get Started
Fundamentals Of Futures And Options Markets
Authors: Jonn C. Hull
8th International Edition
0133382850, 9780133382853