Answered step by step
Verified Expert Solution
Link Copied!

Question

1 Approved Answer

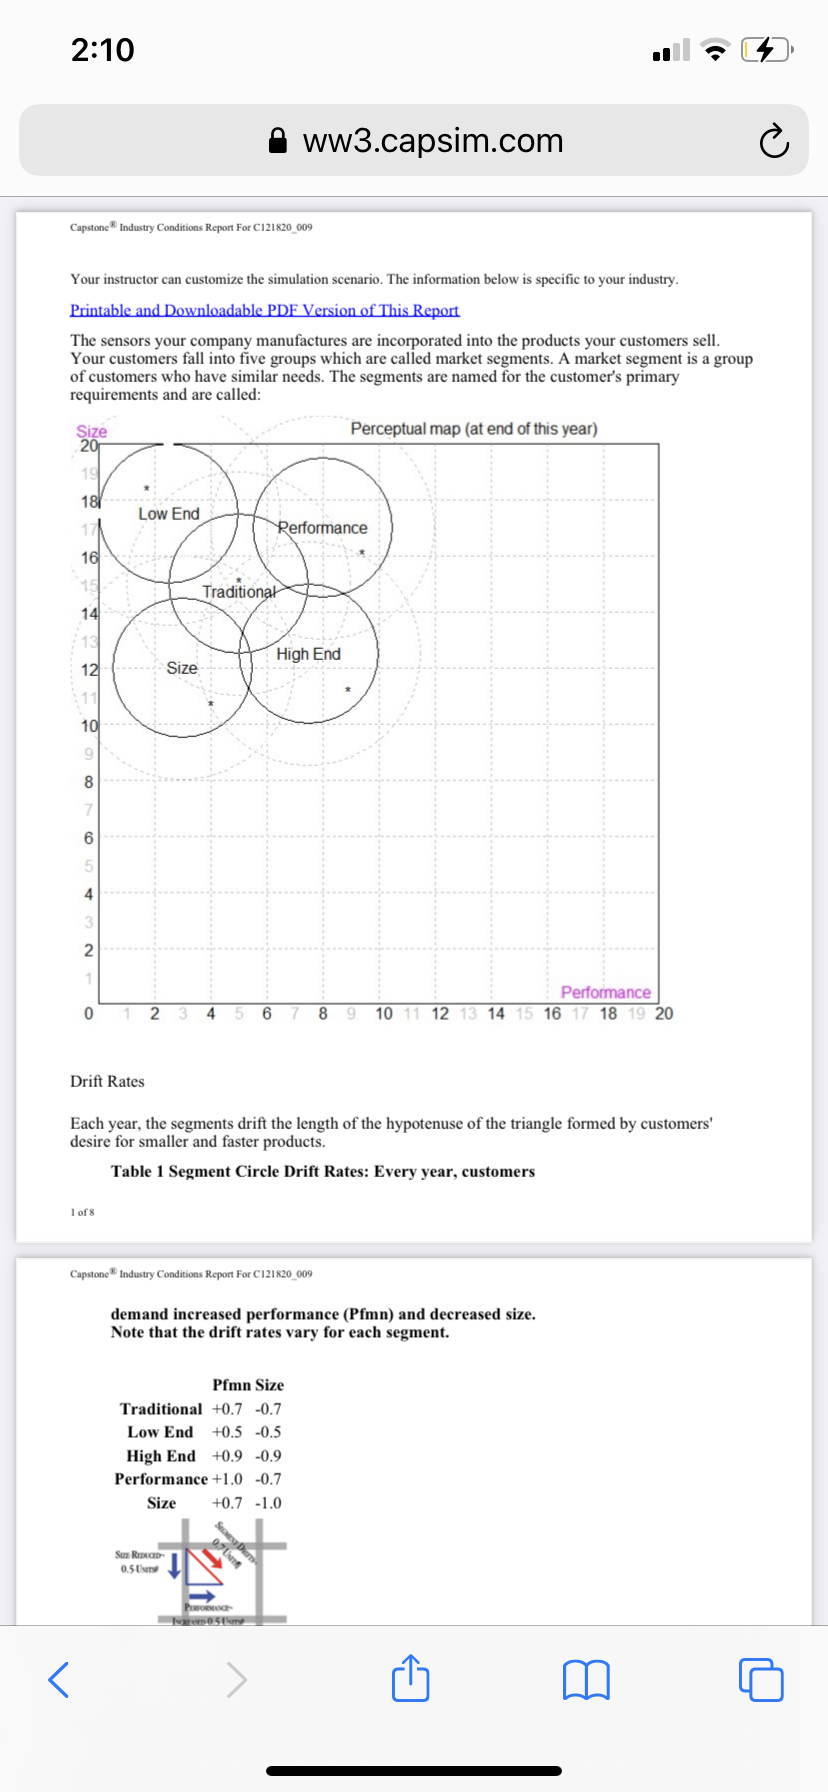
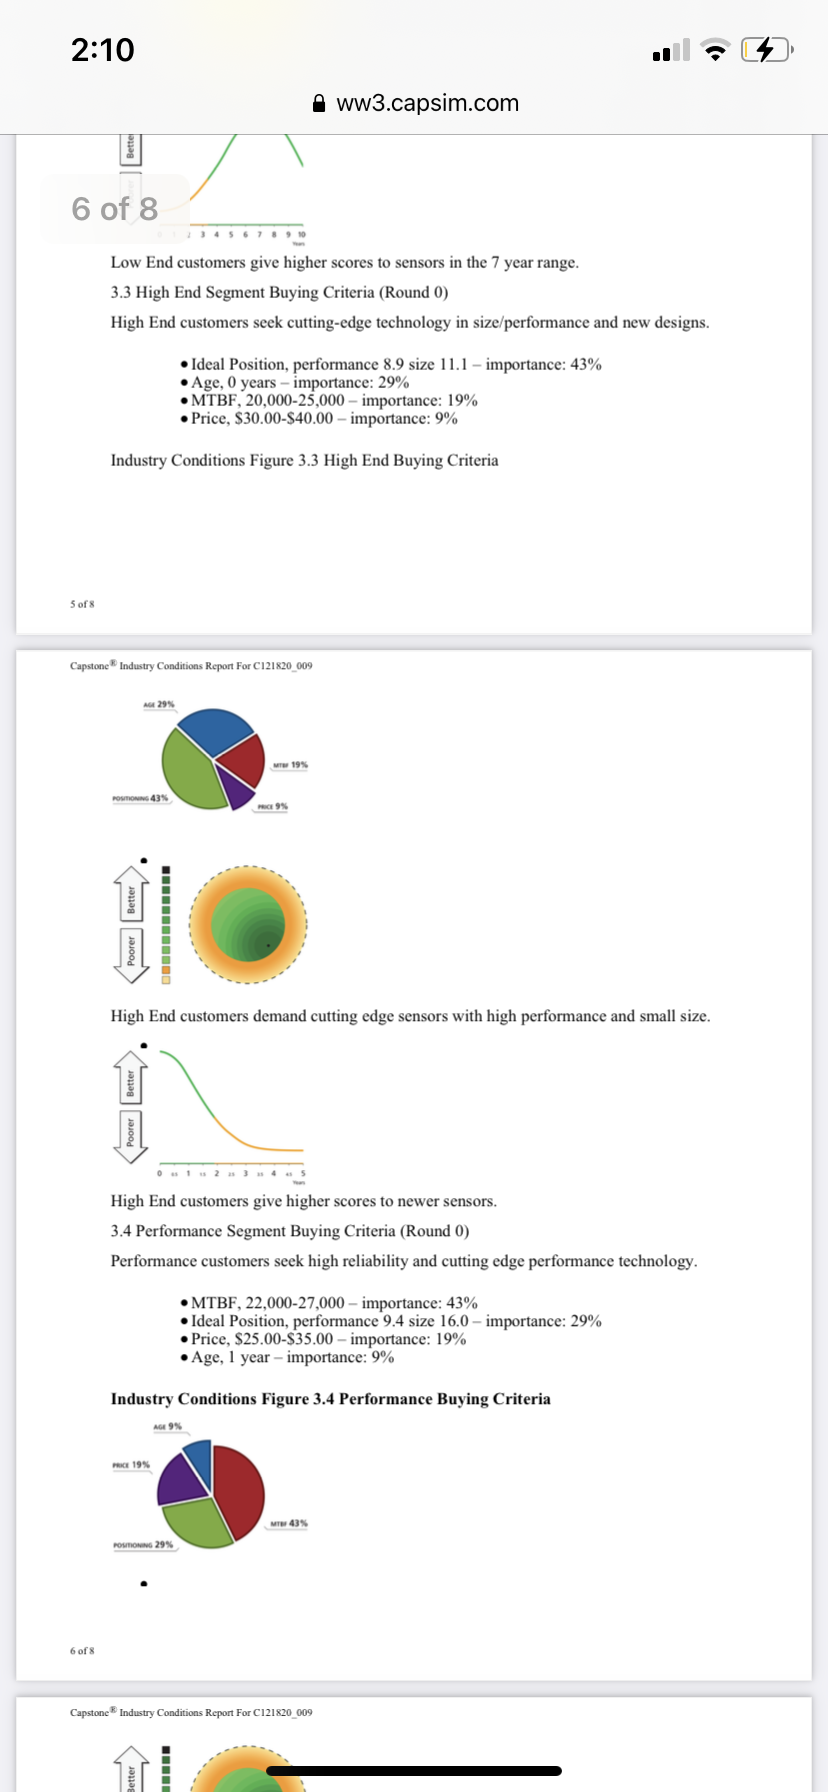
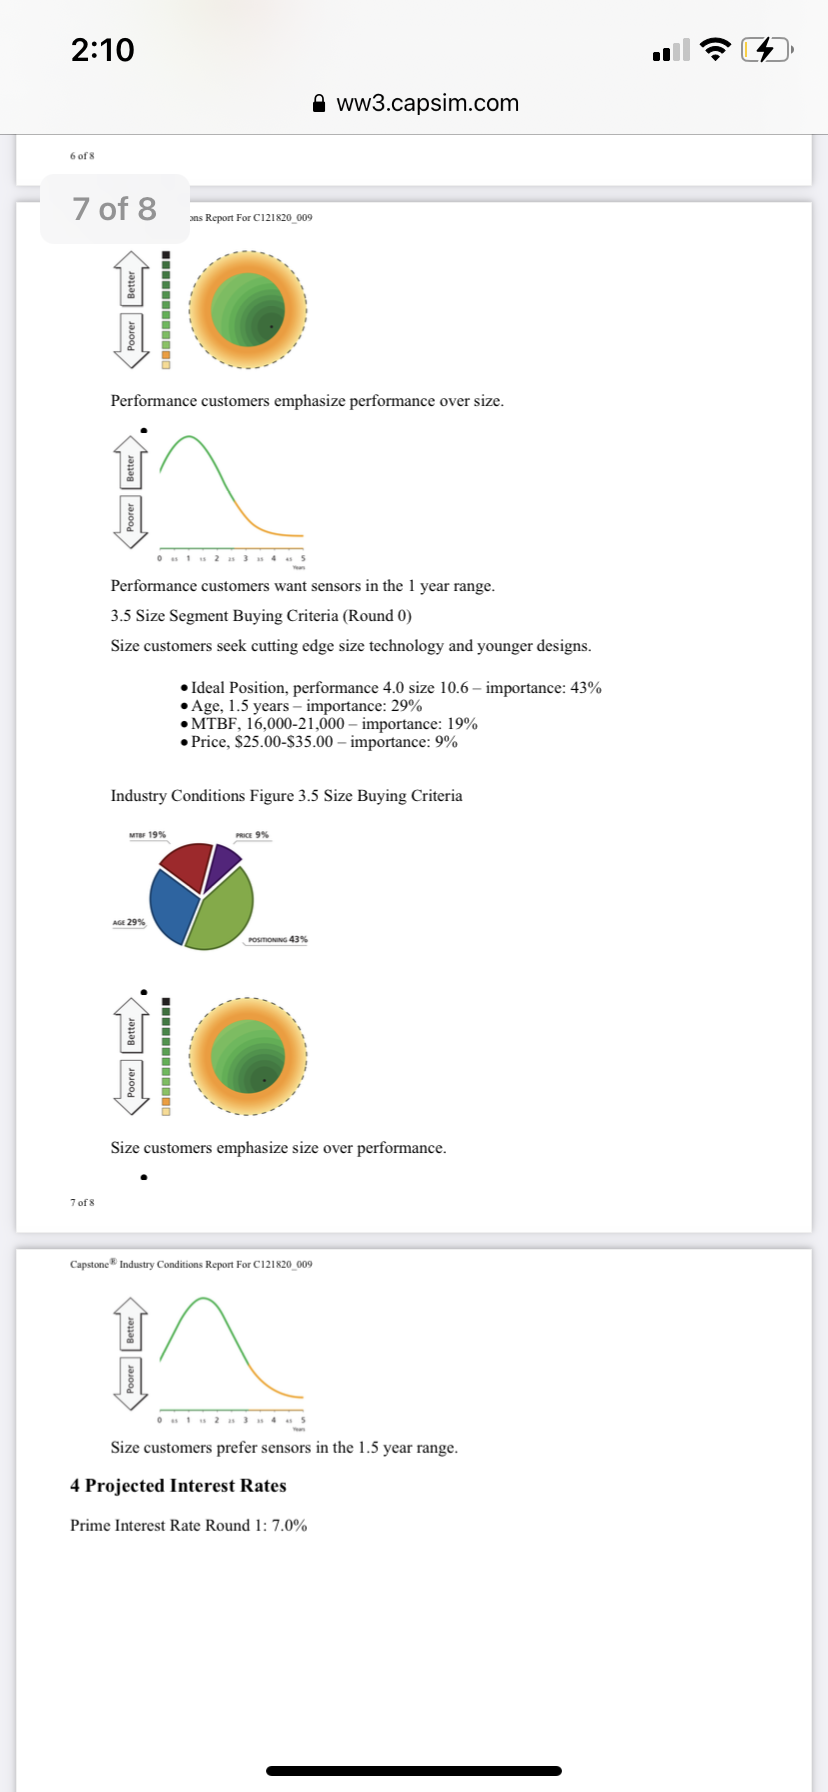
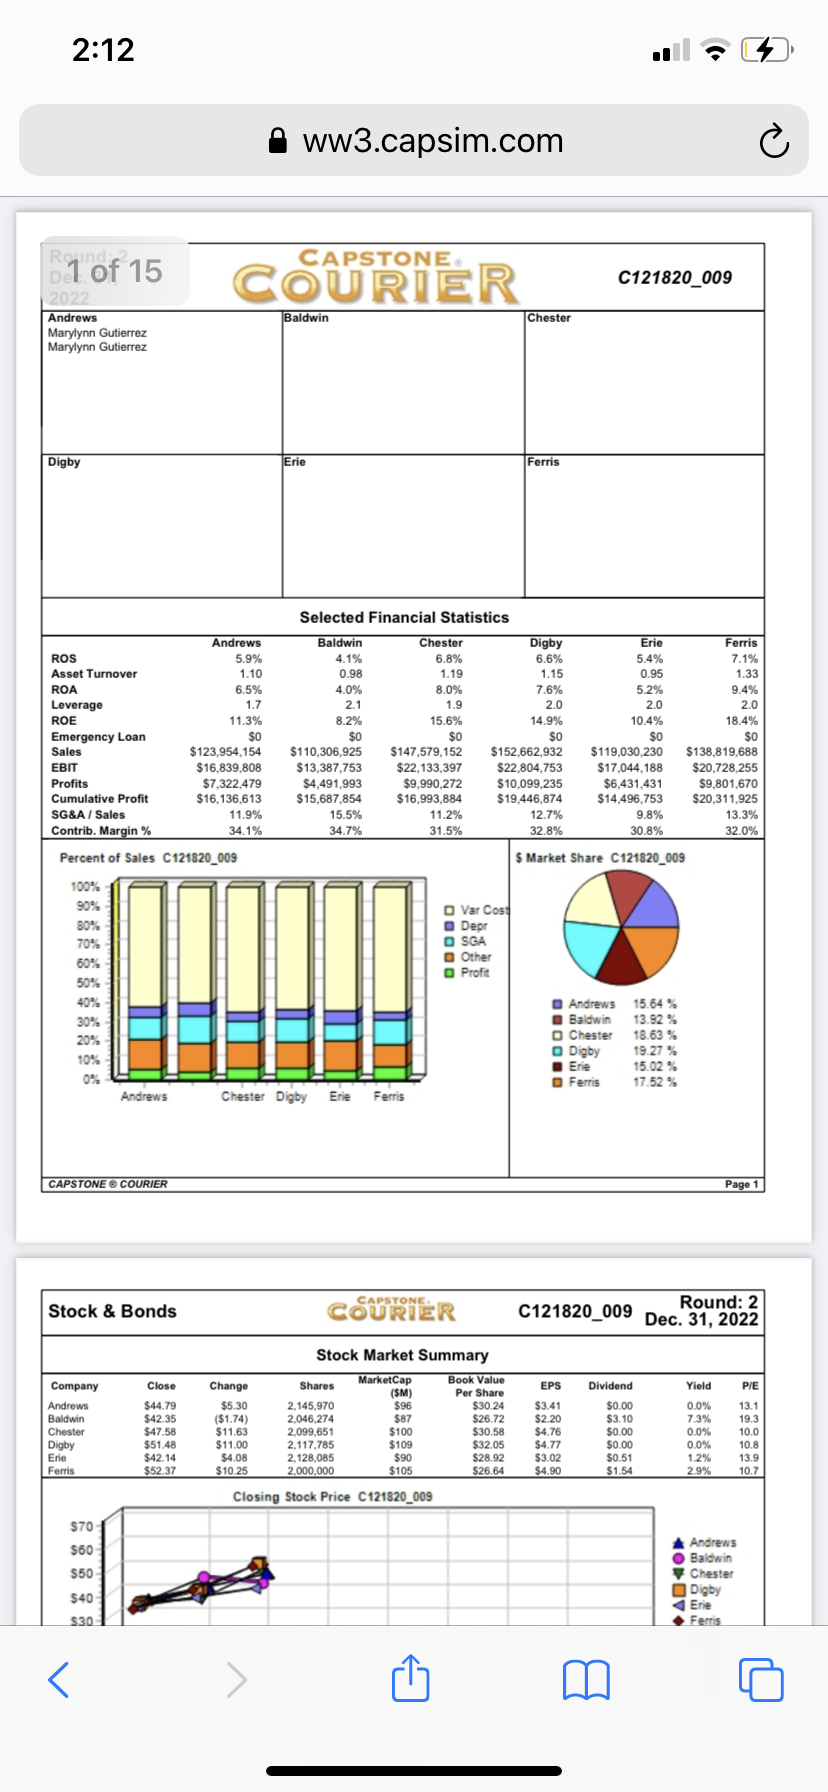
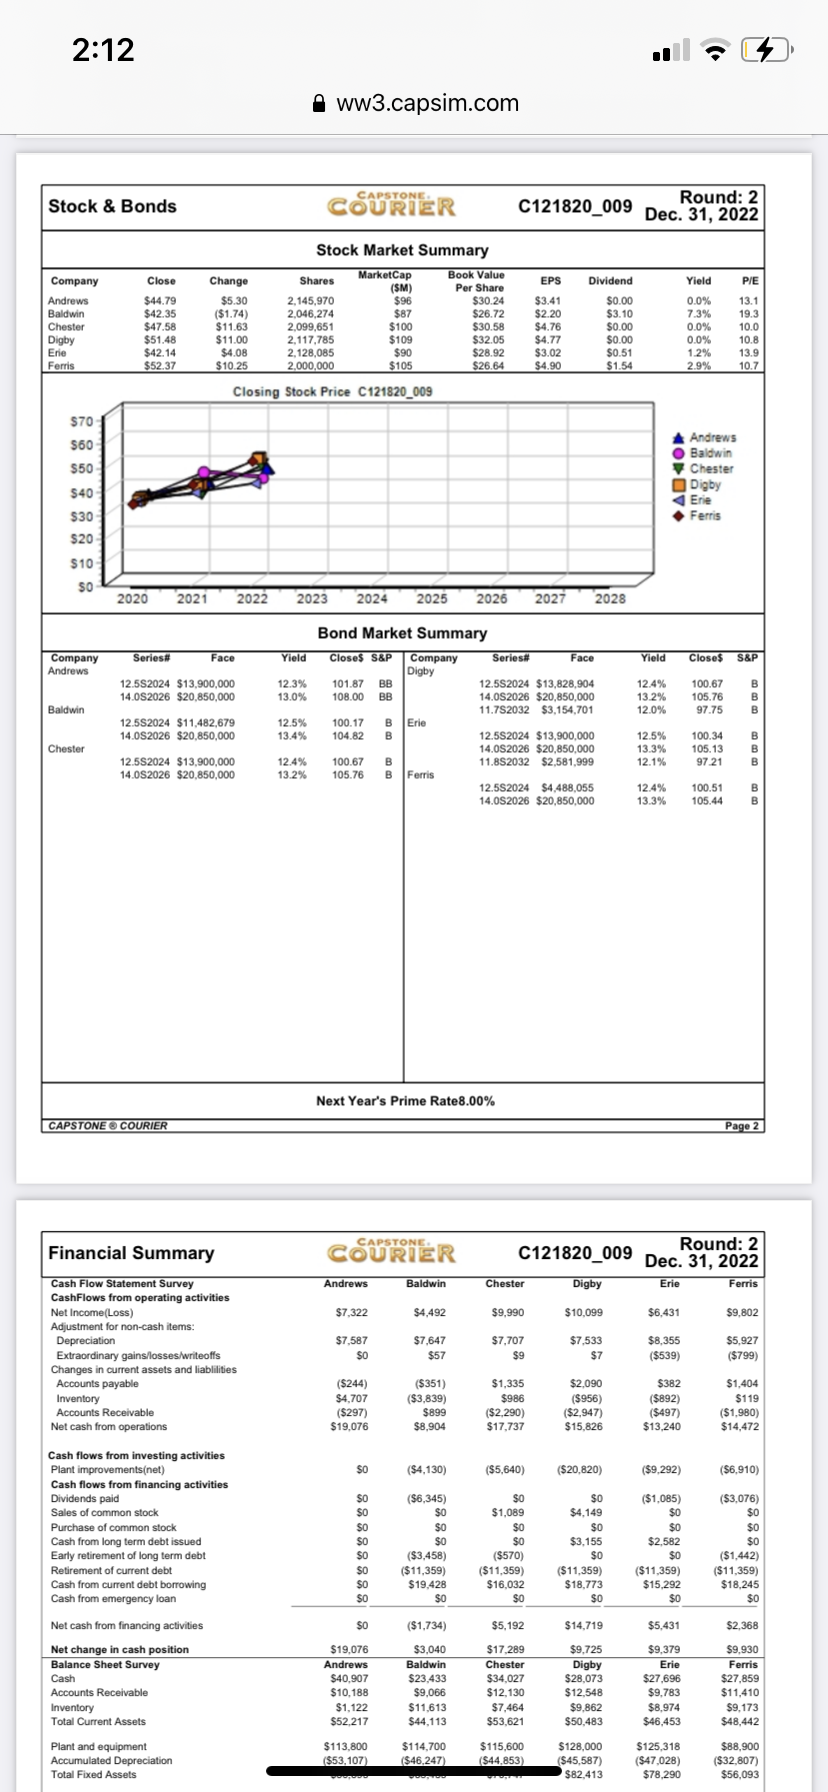
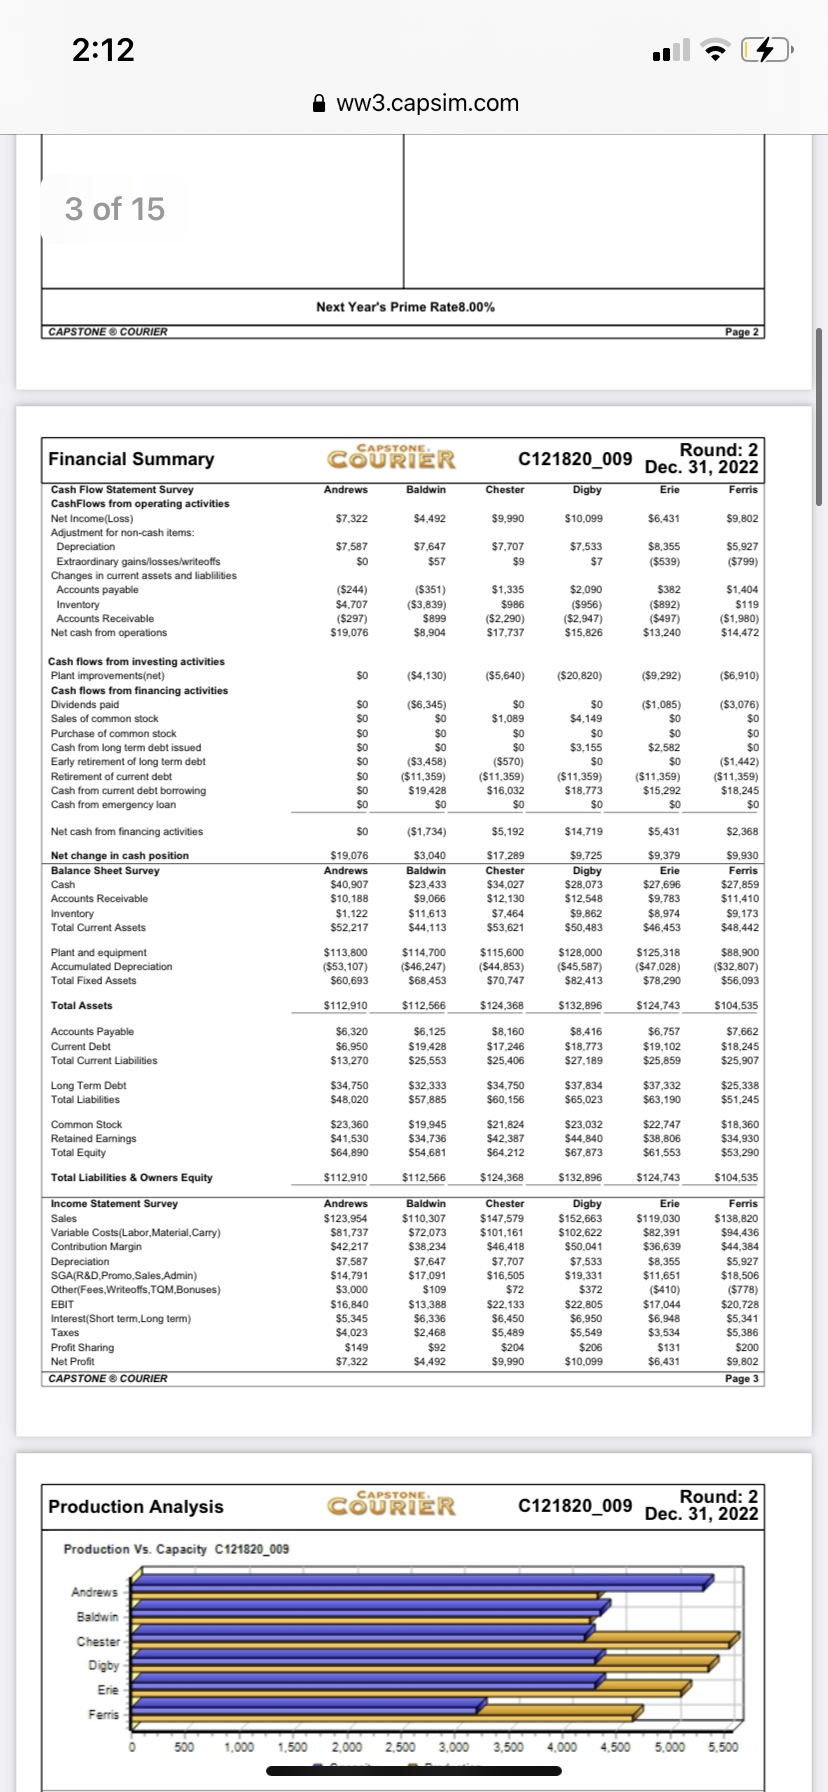
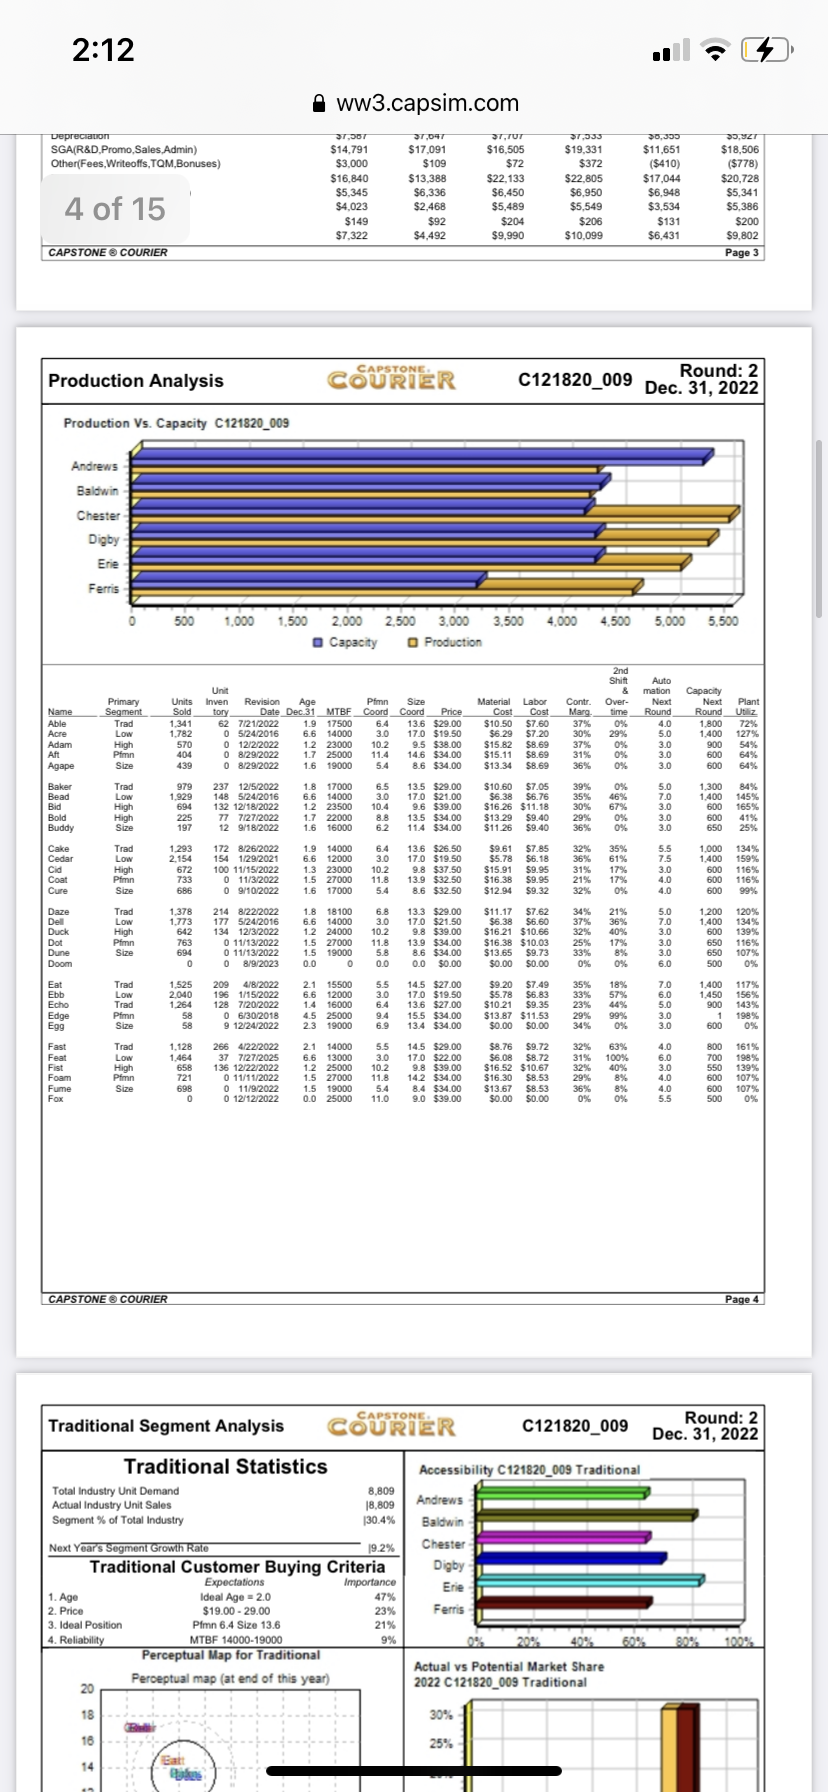
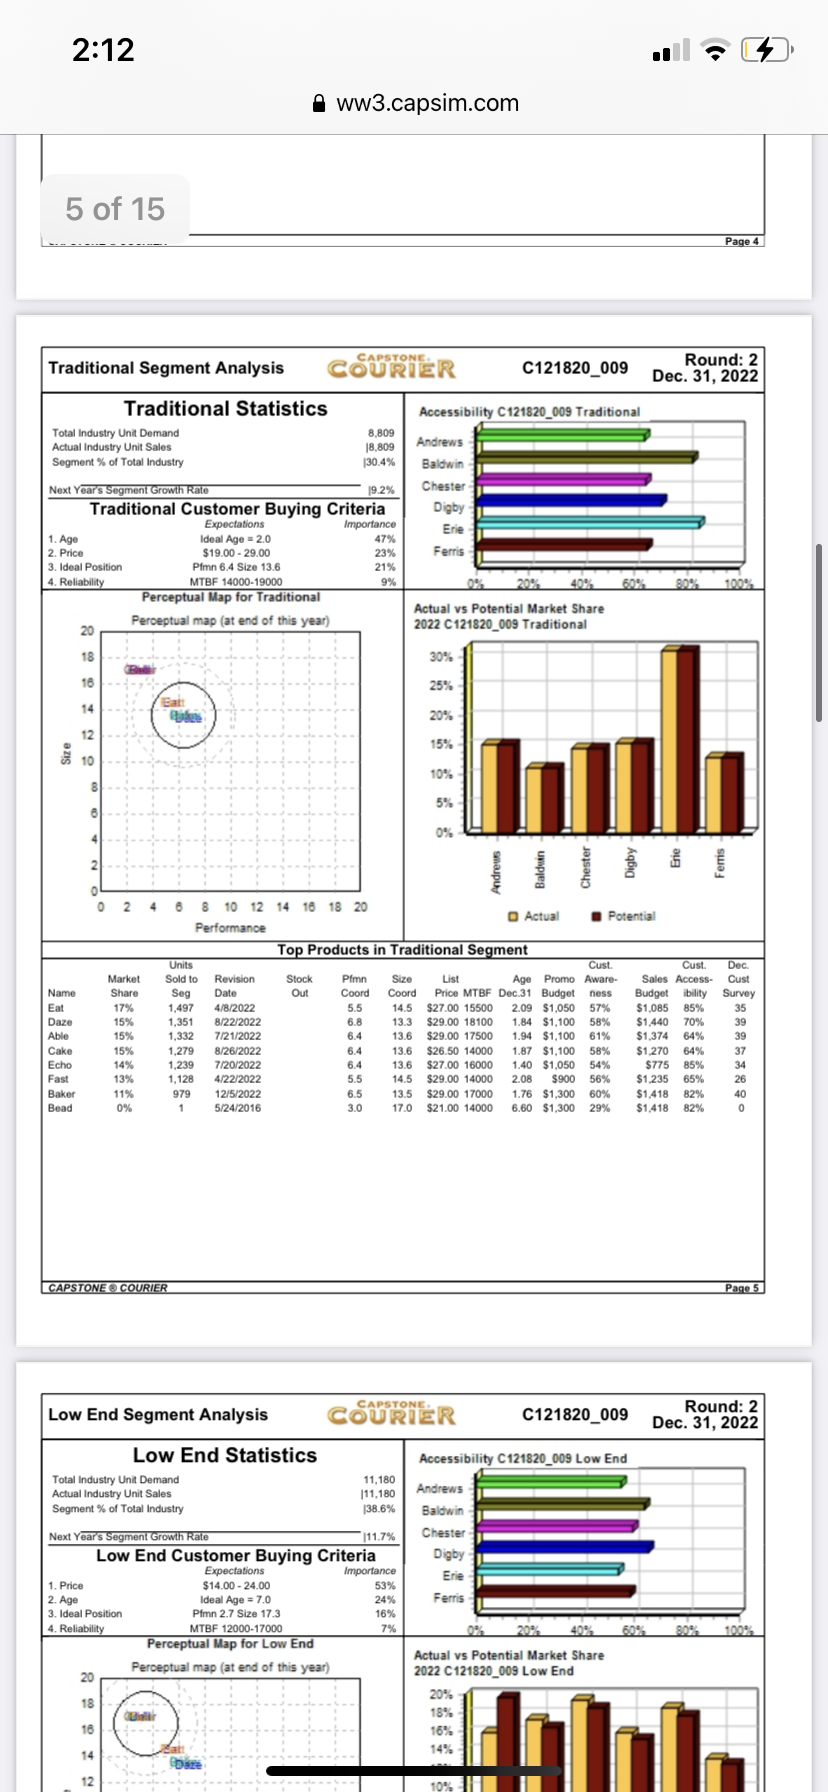
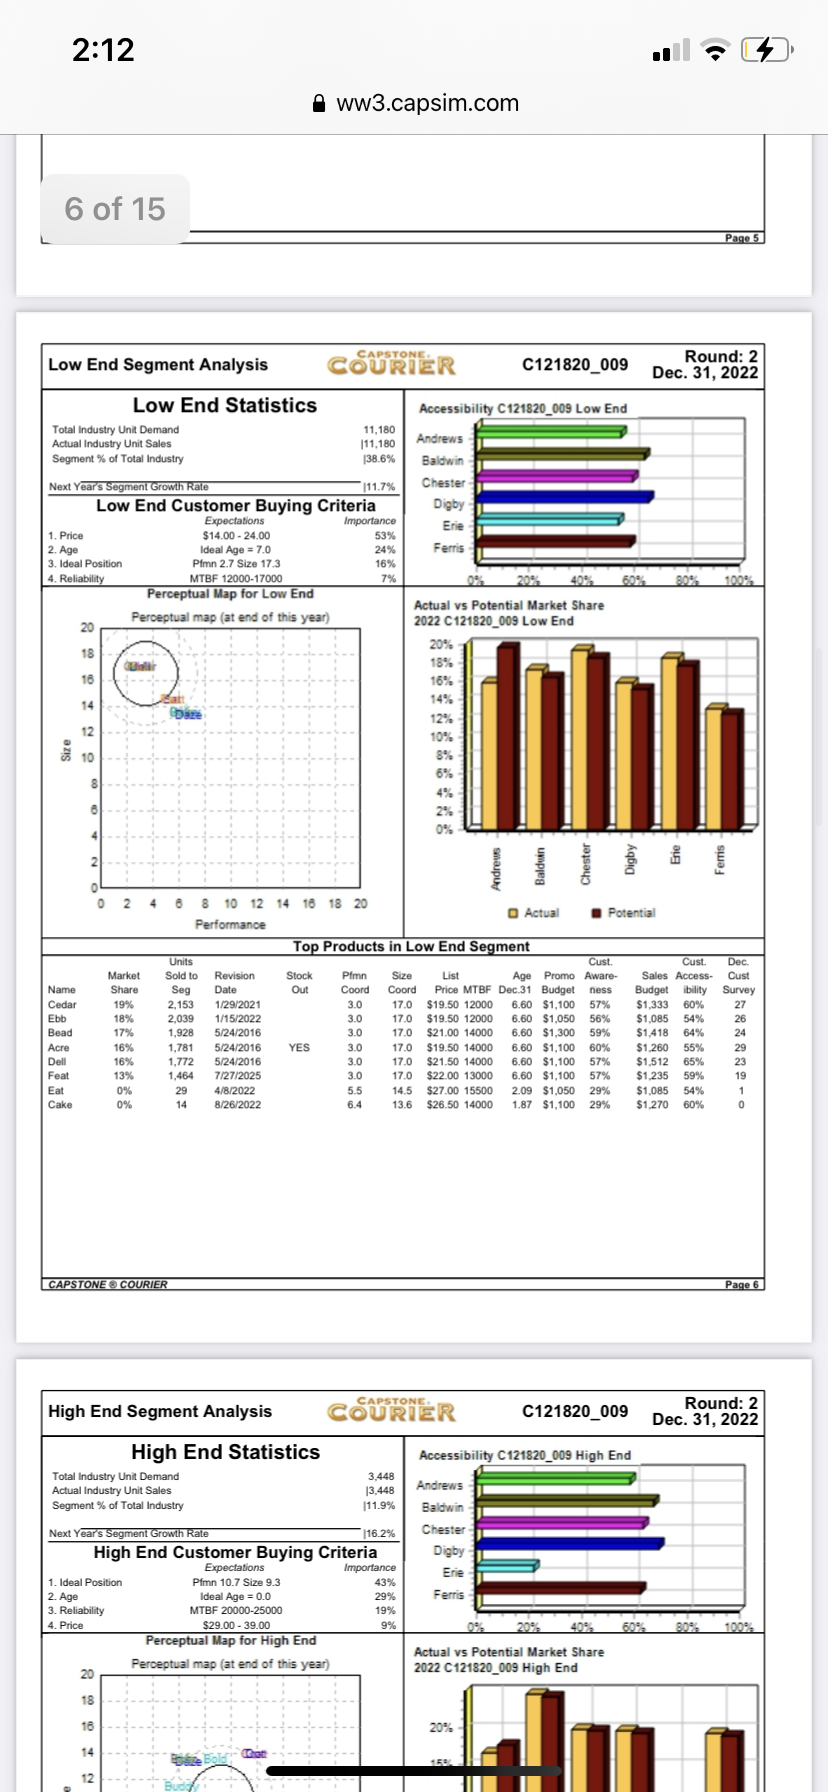
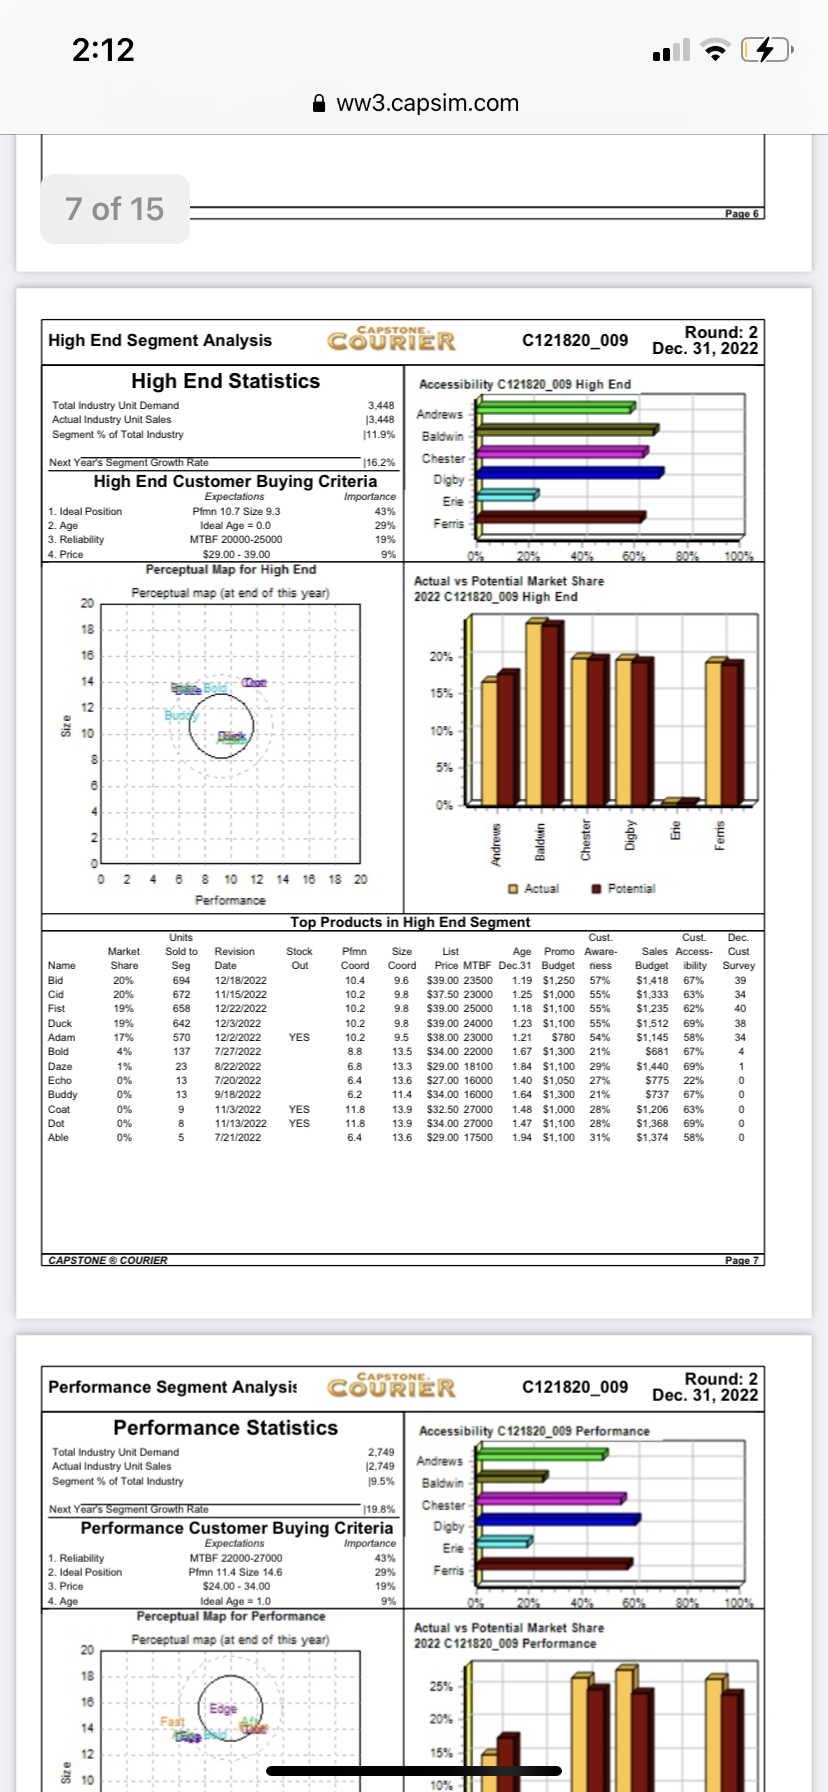
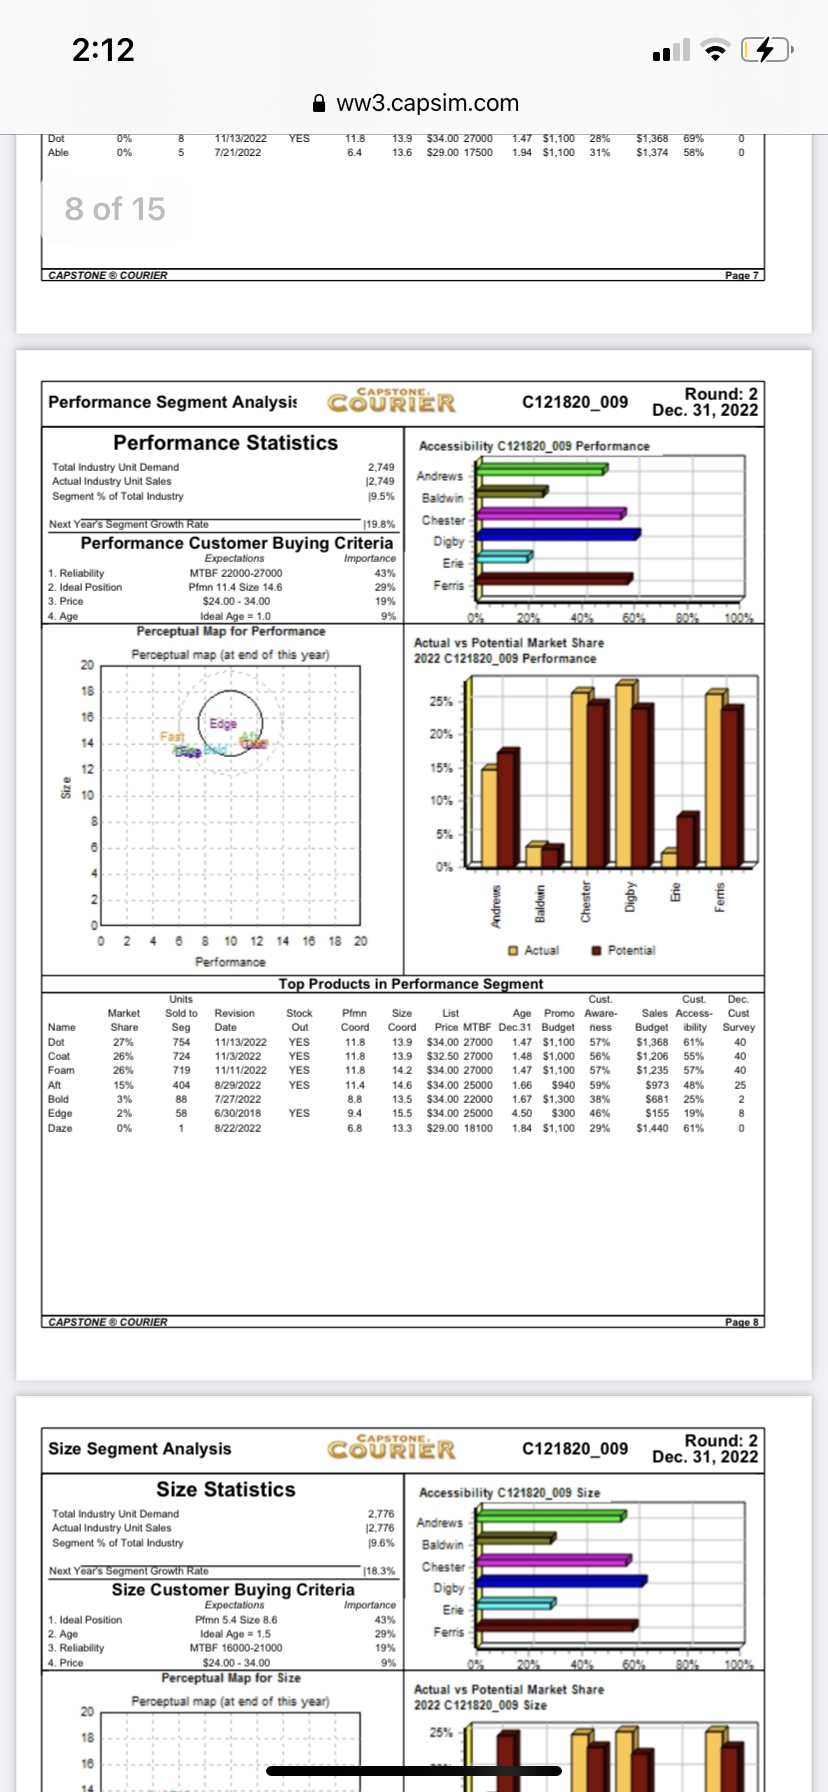
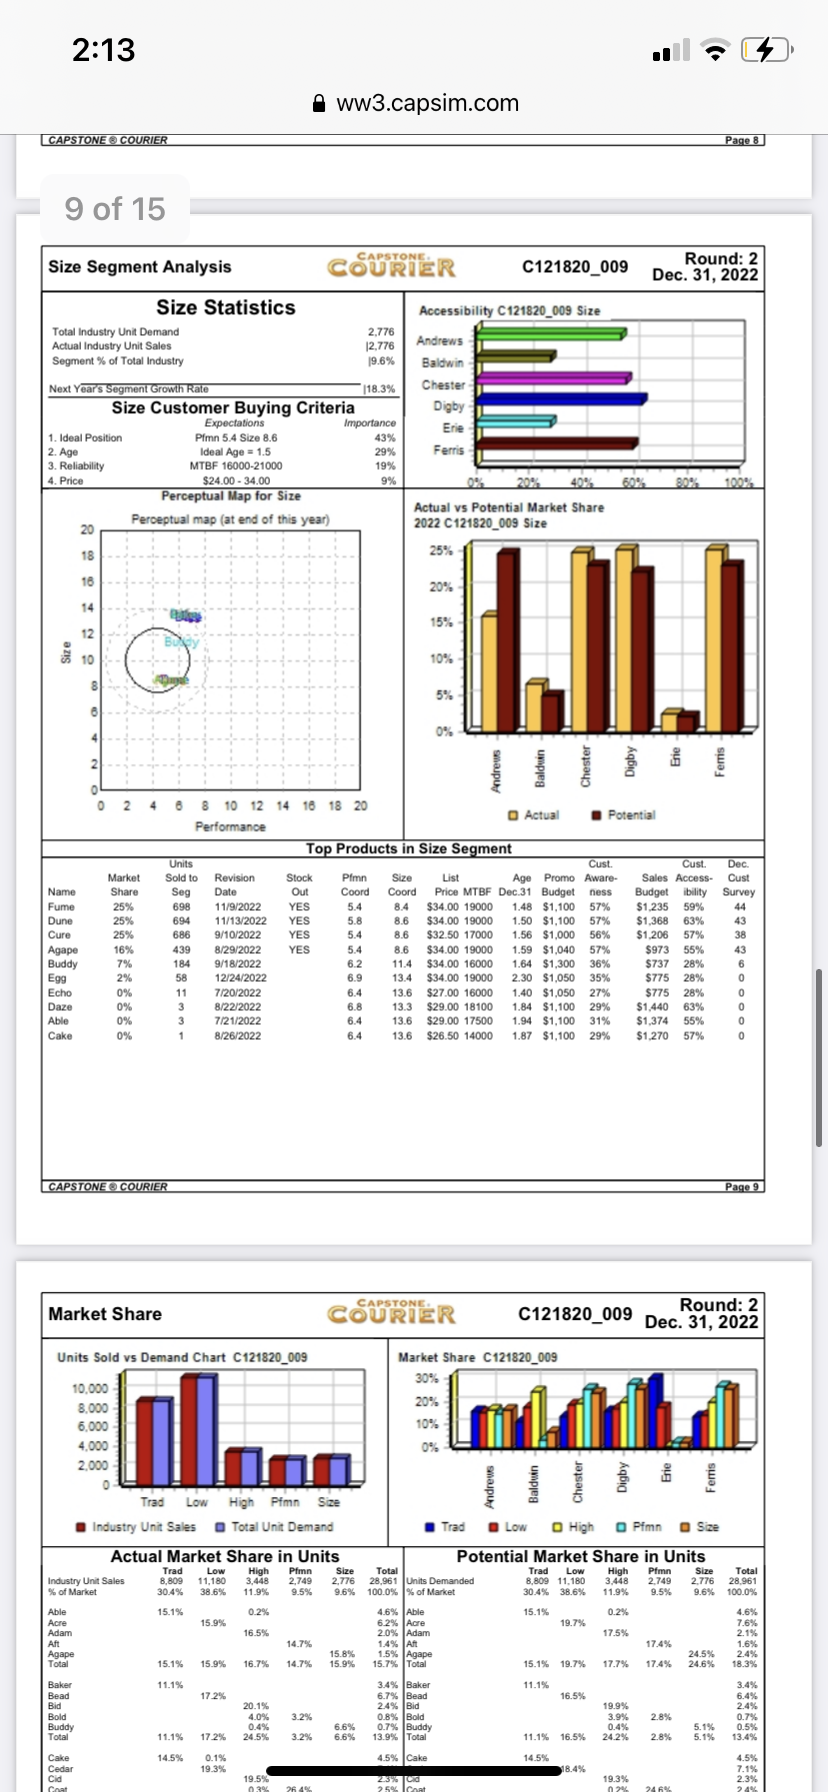
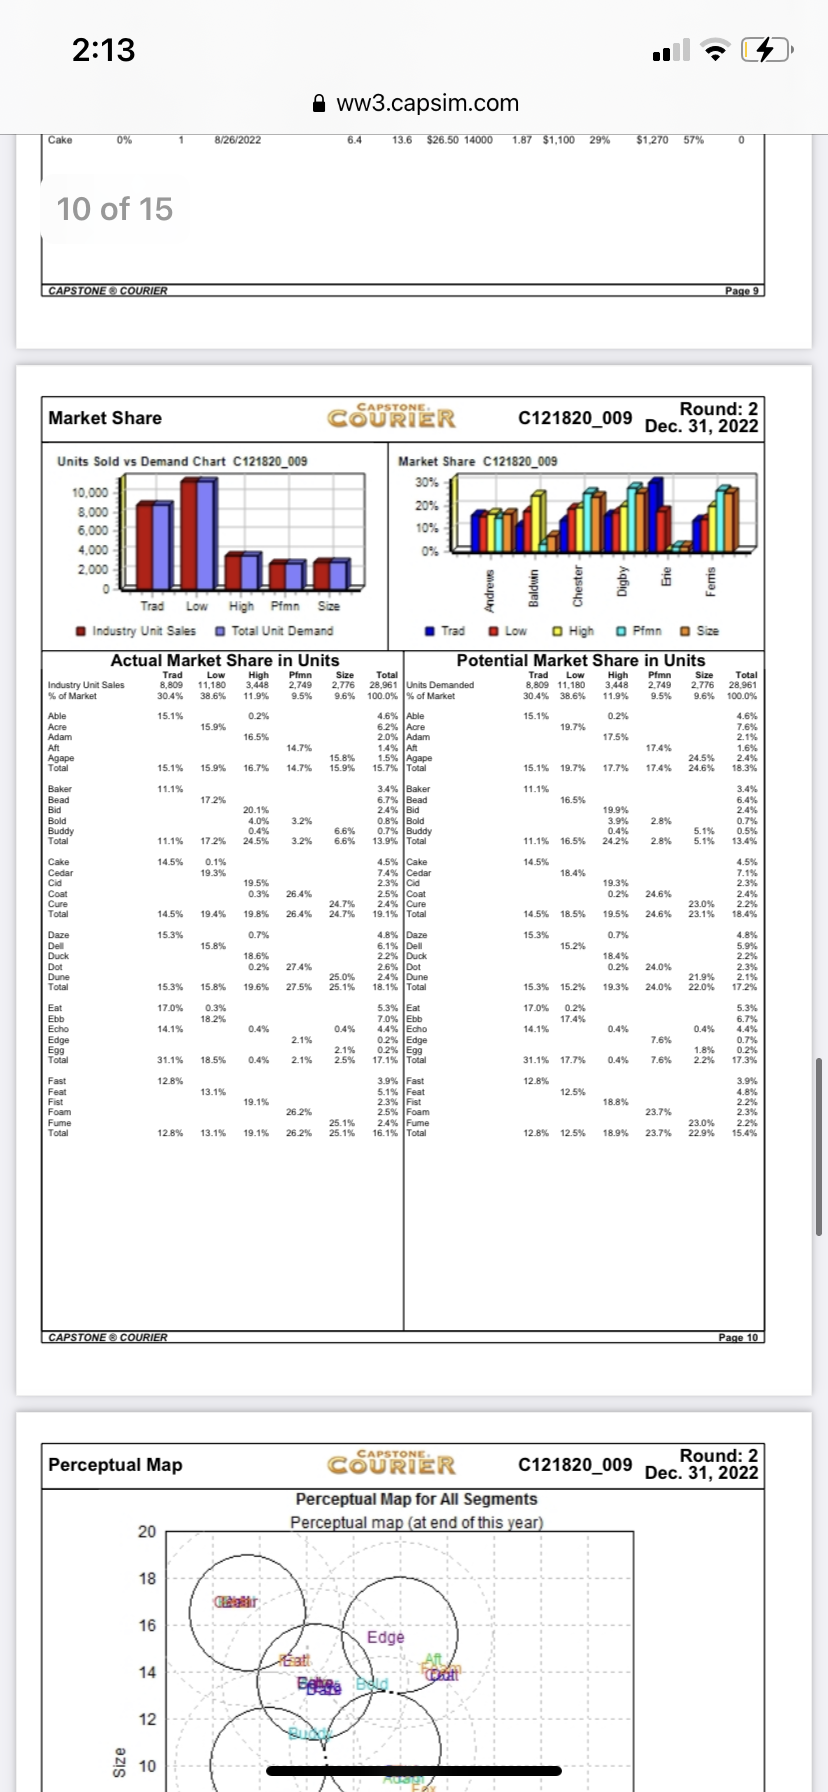
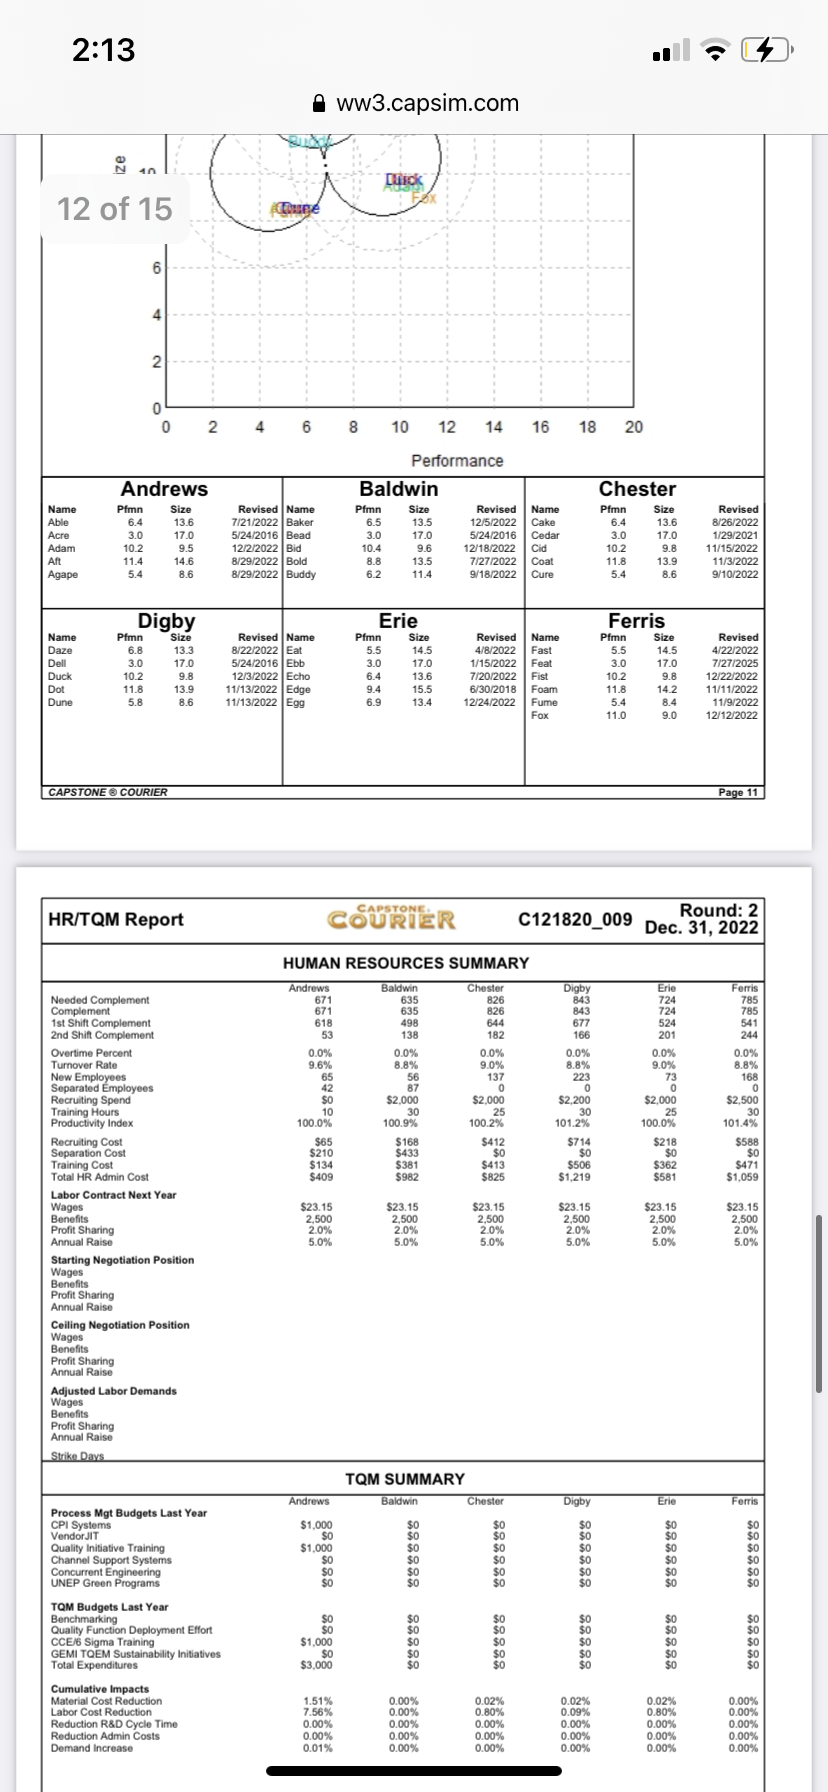
I need Help in round 3. should I raise the prices 2:10 4 ww3.capsim.com C Capstone Industry Conditions Report For C121820_009 Your instructor can customize

I need Help in round 3. should I raise the prices

image text in transcribedimage text in transcribedimage text in transcribedimage text in transcribedimage text in transcribedimage text in transcribedimage text in transcribedimage text in transcribedimage text in transcribedimage text in transcribedimage text in transcribedimage text in transcribedimage text in transcribedimage text in transcribedimage text in transcribedimage text in transcribedimage text in transcribed
2:10 4 ww3.capsim.com C Capstone Industry Conditions Report For C121820_009 Your instructor can customize the simulation scenario. The information below is specific to your industry. Printable and Downloadable PDF Version of This Report The sensors your company manufactures are incorporated into the products your customers sell. Your customers fall into five groups which are called market segments. A market segment is a group of customers who have similar needs. The segments are named for the customer's primary requirements and are called: Size Perceptual map (at end of this year) 18 16 15 14 12 10 N Performance 2 5 6 8 9 10 11 12 13 14 15 16 17 18 19 20 Drift Rates Each year, the segments drift the length of the hypotenuse of the triangle formed by customers' desire for smaller and faster products. Table 1 Segment Circle Drift Rates: Every year, customers 1 of 8 Capstone Industry Conditions Report For C121820_009 demand increased performance (Pfmn) and decreased size. Note that the drift rates vary for each segment. Pfmn Size Traditional +0.7 -0.7 Low End +0.5 -0.5 High End +0.9 -0.9 Performance +1.0 -0.7 Size +0.7 -1.0 0.5 UNITS2210 .III '3' G ' ww3.capsim.com Segment Centers Table 2 Segment Centers at the End of Each Round: As shown in the Perceptual Map Form above. size is on the vertical axis and periornunce (Flinn) Is on the horizontal axis. Traditional Low End High End Performance Sine Round men Size men Size men Size men Size Pf'mn Size 5.0 15.0 2.5 11.515 12.5 8.0 17.0 3.0 l2.0 5.7 14.3 3.0 17.0 8.4 11.69.01 16.3 3.7 11.0 6.4 13.6 3.5 16.5 9.3 10.7 10.0 15.6 4.4 10.0 7.1 12.9 4.0 I6.0 10.2 9.8 11.0 14.9 5.1 9.0 7.8 12.2 4.5 15.5 11.1 8.9 12.0 14.2 5.8 8.0 8.5 11.5 5.0 15.0 12.0 8.0 13.0 13.5 6.5 7.0 9.2 10.8 5.5 14.5 12.9 7.1 14.0 12.8 7.2 6.0 9.9 10.1 6.0 14.0 13.8 6.2 15.0 12.1 7.9 5.0 8 10.6 9.4 6.5 13514.? 5.3 I6.0 11.4 8.6 4.0 Ham-hHNG 111e information in Table 2 reects the segment centers at the end of the round. Therefore. the Round 0 positions can be seen as the Round 1 starting positions. Round 2 positions can be seen as the Round 3 starting position. etc. Each month during the simulation year. the segment dris It 12th of the distance item the starting position to the ending position. Ideal Spots Table 3 Ideal Spot Offsets: Customers prel'er products heated this distance from Zora Capme'hthm Cmilqllt FIICIZISZILM the center of the segment circle. men Size Traditional 0.0 0.0 l-oM'End -0.8 +0.8 HighEnd +1.4 -1.4 PerformanceHA -1.0 Size +1.0 -l.4 The information in Table 3 shows the Ideal Spot \"offsets\" or distances from the segment center. The ideal spot is that point where. all other things being equal. demand is highest. [t is different from the segment center. Why are some ideal spots ahead of the segment centers? The segments are moving. From a customer's perspective. if they buy a product at the ideal spot1 it will still be a cutting edge product when it wears out. 2 Segment Sizes and Growth Rates At the beginning of the simulation. Traditional and low End sell more units than the high technology segments. High End. Performance and Size. Page 10 of the Capstone Courier. the Market Segment Report. displays total industry sales. Each market segment grows at a different rate. Table 4 lists the beginning segment growth rates for your industry. The growth rates might change from year to year. Check the Segment Analysis reports in the Capstone Courier each round for the upcoming year's growth rates. Table 4 Beginning Segment Growth Rates Traditional 9.2% LOW End 1 1.7% High End 162% Performance 198% Size 183% 3 Buying Criteria By Segment These are your products and the primary segments they sell into at the beginning of the simulation. These can change according to your decisions and as the simulation evolves. Able Traditional Acre LOW End 2210 .III \"'3' E53 9 ww3.capsim.com LowEnd 41.8 +0.8 ight-1nd +1.4 -l.4 Ice+1.4 -1.0 3 Of 8 +10 4.4 The rnl'or'matlon in Table 3 shows the Ideal Spot "o'sets' or distances from the segment center. The ideal spot is that point where. all other things being equal. demand is highest. It is different from the segment center. Why are some ideal spots ahead of the segment centers? The segments are moving. From a customer's perspective. if they buy a product at the ideal spot. it will still be a cutting edge product when it wears out. 2 Segment Sizes and Growth Rates At the beginning of the simulation. Traditional and Low End sell more units than the high technology segments. High End. Performance and Size. Page 10 of the Capstone Courier. the Market Segment Report, displays total industry sales. Each market segment grows at a different rate. Table 4 lists the beginning segment growth rates for your industry. The growth rates might change from year to year. Check the Segment Analysis reports in the Capstone Courier each round for the upcoming year's growth rates. Table 4 Beginning Segment Growth Rates Traditional 9.2% Low End 11.7% High End 162% Performance 19.8% Size 18.3% 3 Buying Criteria By Segment These are your products and the primary segments they sell into at the beginning of the simulation. These can change according to your decisions and as the simulation evolves. Able Traditional Acre Low End Adam High End Aft Performance Agape Size 3 of! cm\" rum Continua Rm FuCIZlmjll'l The buying criteria for each segment. in order of importance. are displayed below. Positioning and Age score information also display. Passing your cursor over an image will enlarge it. See (llapter 3 of the Team Member Guide for explanations of Positioning. Age. Price and MTBF scores. 3.] Traditional Segment Buying Criteria (Round 0) Traditional customers seek proven products at a modest price. oAge. 2 years - importance: 47% 0 Price. 52000-53000 - importance: 23% 0 [deal Position, performance 5.0 size 15.0 importance: 21% - MTBF. 14.00049,\" - irnpormnoe: 9% Industry Conditions Figure 3.1: Traditional Buying Criteria Imam-52W. 5"\": mutt . m m Traditional customer's give higher position scores to sensors located in the center of the segment circle. 2:10 14 aww3.capsim.com PROCE 23% 5 of 8 Better Poorer Traditional customers give higher position scores to sensors located in the center of the segment circle. Better Poorer Traditional customers give higher scores to sensors in the 2 year range. 3.2 Low End Segment Buying Criteria (Round 0) Low End customers seek low prices and well proven products. . Price, $15.00-$25.00 - importance: 53% 4 of 8 Capstone Industry Conditions Report For C121820_009 Age, 7 years - importance: 24% . Ideal Position, performance 1.7 size 18.3 - importance: 16% . MTBF, 12,000-17,000 - importance: 7% Industry Conditions Figure 3.2 Low End Buying Criteria POUTING 16 % 404 24%% Better Poorer Low End customers prefer inexpensive sensors with slower performance and larger size. Better Low End customers give higher scores to sensors in the 7 year range. 3.3 High End Segment Buying Criteria (Round 0) High End customers seek cutting-edge technology in size/performance and new designs. . Ideal Position, performance 8.9 size 11.1 - importance: 43% . Age, 0 years - importance: 29% . MTBF, 20,000-25,000 - importance: 19% . Price, $30.00-$40.00 - importance: 9% Industry Conditions Figure 3.3 High End Buying Criteria 5 of 82:10 14 aww3.capsim.com 6 of 8 1 3 4 5 6 7 8 9 10 Low End customers give higher scores to sensors in the 7 year range. 3.3 High End Segment Buying Criteria (Round 0) High End customers seek cutting-edge technology in size/performance and new designs. . Ideal Position, performance 8.9 size 11.1 - importance: 43% . Age, 0 years - importance: 29% . MTBF, 20,000-25,000 - importance: 19% . Price, $30.00-$40.00 - importance: 9% Industry Conditions Figure 3.3 High End Buying Criteria 5 of 8 Capstone Industry Conditions Report For C121820_009 AGA 29% METER 19%% Better Poorer High End customers demand cutting edge sensors with high performance and small size. Better Poorer 0as 1 2 2 3 a 4 High End customers give higher scores to newer sensors. 3.4 Performance Segment Buying Criteria (Round 0) Performance customers seek high reliability and cutting edge performance technology. . MTBF, 22,000-27,000 - importance: 43% . Ideal Position, performance 9.4 size 16.0 - importance: 29% . Price, $25.00-$35.00 - importance: 19% . Age, 1 year - importance: 9% Industry Conditions Figure 3.4 Performance Buying Criteria AGE 9% PRICE 19% MTM 43% NOWTONING 29%% 6 of 8 Capstone Industry Conditions Report For C121820_009 Better2:10 4 aww3.capsim.com 6 of 8 7 of 8 ans Report For C121820_009 Better Poorer Performance customers emphasize performance over size. Better Poorer Performance customers want sensors in the 1 year range. 3.5 Size Segment Buying Criteria (Round 0) Size customers seek cutting edge size technology and younger designs. . Ideal Position, performance 4.0 size 10.6 - importance: 43% . Age, 1.5 years - importance: 29% . MTBF, 16,000-21,000 - importance: 19% . Price, $25.00-$35.00 - importance: 9% Industry Conditions Figure 3.5 Size Buying Criteria MTEF 19% AGE 29% ONIN 43%% Poorer Better Size customers emphasize size over performance. 7 of 8 Capstone Industry Conditions Report For C121820_009 Better Poor Size customers prefer sensors in the 1.5 year range. 4 Projected Interest Rates Prime Interest Rate Round 1: 7.0%2:12 ww3.capsim.com C 1 of 15 CAPSTONE. COURIER C121820_009 2022 Andrews Baldwin Chester Marylynn Gutierrez Marylynn Gutierrez Digby Erie Ferris Selected Financial Statistics Andrews Baldwin Chester Digby Erie Ferris ROS 5.9% 4.1% 6.8% 6.6% 5.4% 7.19 Asset Turnover 1.10 0.98 1.19 1.15 0.95 1.33 ROA 6.5% 4.0% 8.0% 7.6% 5.2% 9.4% Leverage 1.7 2.1 1.9 2.0 2.0 2.0 ROE 11.3% B.2% 15.6% 14.9% 10.4% 18.4% Emergency Loan $0 SO SO Sales $123,954,154 $1 10,306,925 $147,579,152 $152.662,932 $119,030,230 $138,819,688 EBIT $16,839,808 $13,387,753 $22,133,397 $22,804,753 $17,044,188 $20,728,255 Profits $7,322,479 $4,491,993 $9,990,272 $10,099,235 $6,431,431 $9,801,670 Cumulative Profit $16,136,613 $15,687,854 $16,993,884 $19,446,874 $14.496,753 $20,311,925 SG&A / Sales 11.9% 15.5% 11.2% 12.7% 9.8% 13.39% Contribargin % 34.1% 34.7% 31.5% 32.8% 30.8% 32.0% Percent of Sales C121820_009 $ Market Share C121820_009 100% 90% Var Cost 80% Depr 70% D SGA 60% Other Profit 50% 40% O Andrews 15.64 % 30% O Baldwin 13.92 % 20% O Chester 18.63 % O Digby 19.27 % 10% Erie 15.02 % 0% O Ferris 17.52 % Andrews Chester Digby Erie Ferris CAPSTONE @ COURIER Page 1 Stock & Bonds COURIER Round: 2 C121820_009 Dec. 31, 2022 Stock Market Summary Company Close Change Shares MarketCap Book Value (SM) Per Share EPS Dividend Yield P/E Andrews $44.79 $5.30 2,145,970 $96 $30.24 $3.41 $0.00 0.0% 13.1 Baldwin $42.35 ($1.74) 2,046,274 $87 $26.72 $2.20 $3.10 7.3% 19.3 Chester $47.58 $11.63 2.099.651 $100 $30.58 $4,76 $0.00 0.0% 10.0 Digby $51.48 $11.00 2,117,785 $109 $32.05 $4.77 $0.00 0.0% 10.8 Erie $42.14 $4.08 2,128,085 $90 $28.92 $3.02 $0.51 1.2% 13.9 Ferris $52.37 $10.25 2.000,000 $105 $26.64 $4.90 $1.54 2.9% 10.7 Closing Stock Price C121820_009 $70 $60 Andrews O Baldwin $50 V Chester Digby $40 Erie $30 Ferris2:12 aww3.capsim.com Stock & Bonds COURIER Round: 2 C121820_009 Dec. 31, 2022 Stock Market Summary Company Close Change Shares Book Value (SM) Per Share EPS Dividend Yield P/E Andrews $5.30 2.145,970 $96 $30.24 $3.41 $0.00 0.0% 13.1 $42.35 ($1.74) 2.046.274 $87 $26.72 $2.20 $3.10 7.3% 19.3 $47.58 $11.63 2.099,651 $100 $4.76 $0.00 0.0% 10.0 Digby $51.48 $11.00 2,117.785 $109 $32.05 $4,77 $0.00 0.0% 10.8 Erie $42.14 $4.08 2,128,085 $90 $28.92 $3.02 $0.51 1.2% 13.9 Ferris $52.37 $10.25 2.000,000 $105 $26.64 $4.90 $1.54 2.9% 10.7 Closing Stock Price C121820_009 $70 $60 O Baldwin $50 V Chester $40 Erie $30 $20 $10 So 2020 2021 2023 2025 2027 Bond Market Summary Company Face Company Digby 12.582024 $13,900,000 12.3% 101.87 BB 12.582024 $13,828,904 12.4% 100.67 14.082026 $20,850,000 13.0% BB 14.052026 $20,850,000 13.2% 105.76 Baldwin 11.752032 $3,154,701 12.0% 97.75 12.582024 $11.482,679 12.5% 100.17 B Erie 14.082026 $20.850,000 13.4% 12.5S2024 $13,900,000 12.5% 100.34 Chester 14.052026 $20,850,000 13.3% 105.13 12.582024 $13,900,000 12.4% 100.67 11.852032 $2,581,999 12.1% 14.082026 $20.850,000 13.2% Ferris 12.5S2024 $4.488,055 100.51 14.052026 $20,850,000 13.3% 105.44 Next Year's Prime Rate8.00% CAPSTONE @ COURIER Page 2 Financial Summary COURIER Round: 2 C121820_009 Dec. 31, 2022 Cash Flow Statement Survey Andrews Baldwin Chester Digby Eri Ferris CashFlows from operating activities Net Income(Loss) $7,322 $4,492 $9,990 $10,099 $6,431 $9,802 Adjustment for non-cash items: Depreciation $7,587 $7.647 $7,533 $8,355 $5,927 Extraordinary gains/losses/writeoffs SO $57 SO $7 ($539) ($799 Changes in current assets and liablilities Accounts payable ($351) $382 $1,404 $3,839) $986 ($956 ($892) $119 Accounts Receivable ($297 $899 $2,290) ($497) Net cash from operations $19,076 $8,904 $17,737 $13,240 Cash flows from investing activities Plant improvements(net) SO ($4,130) ($5,640) ($20,820) ($9,292) ($6,910) Cash flows from financing activities Dividends paid So ($6,345) $0 ($1,085) ($3.076) Sales of common stock SO $1,089 $4,149 $0 Purchase of common stock SO SO SO SO $0 Cash from long term debt issued SO $3.155 $2,582 Early retirement of long term debt SO ($3,458) ($570) SO ($1,442) Retirement of current debt SO $11,359) $11,359) $11,359) ($11,359) ($11,359) Cash from current debt borrowing SO $19,428 $16,032 $15,292 $18,245 Cash from emergency loan SO SO Net cash from financing activities SO ($1,734) $5,192 $14,719 Net change in cash position $19,076 $3.040 $17.289 $9,379 $9,930 Balance Sheet Survey Digby Erie $23,433 $27,859 Accounts Receivable $10,188 $12,130 $12,548 $9,783 $11,410 Inventory $11,613 $8,974 $9,173 Total Current Assets $50,483 $46,453 $48,442 Plant and equipment $114,700 $115,600 $128,000 $125,318 $88,900 Accumulated Depreciation ($53,107) ($46,247) $45,587) ($47,028) ($32,807) Total Fixed Assets $82,413 $78,290 $56,0932:12 aww3.capsim.com 3 of 15 Next Year's Prime Rate8.00% CAPSTONE @ COURIER Page 2 Financial Summary COURIER Round: 2 C121820_009 Dec. 31, 2022 Cash Flow Statement Survey Andrews Baldwin Digby Ferris CashFlows from operating activities Net Income(Loss) $7,322 $4,492 $9,990 $10,099 $6,431 $9,802 Adjustment for non-cash items: Depreciation $7,587 $7.647 $7,533 $8,355 Extraordinary gains/losses/writeoffs $57 ($539) ($799) Changes in current assets and liablilities Accounts payable ($351) $2,090 $382 $1.404 $3,839) $986 ($956 $119 Inventory ($892) Accounts Receivable ($297 $899 $2,290) ($2,947) Net cash from operations $19,076 $8,904 $17,737 $15,826 $13,240 $14,472 Cash flows from investing activities ($4,130) ($5,640) ($9,292) Cash flows from financing activities Dividends paid So ($1,085) ($3,076) Sales of common stock SO $1.089 $4.149 $0 Purchase of common stock SO SO SO Cash from long term debt issued SO $3,155 $2,582 Early retirement of long term debt SO ($3,458) ($570) SO ($1,442) Retirement of current debt 8 88 ($11,359) ($11,359) ($11,359) $11,359 Cash from current debt borrowing $19,428 $16,032 $15,292 $18,245 Cash from emergency loan Net cash from financing activities SO ($1,734) $5,192 $14,719 Net change in cash position $19,076 $3,040 $17,289 $9,72 $9,379 $9,930 Balance Sheet Survey Chester Digby Erie Cas $40,907 $23,433 $34,027 $28,073 $27,696 $27,859 Accounts Receivable $10,188 $9,066 $12,130 $12,548 $9,783 $11,410 Inventory $11,613 $7,464 $8,974 Total Current Assets $44,113 $53,621 $46,453 $48,442 Plant and equipment $113,800 $114,700 $115,600 $128,000 $125,318 $88,900 Accumulated Depreciation $53,107) ($46,247) ($44,853) ($45,587) ($47,028) ($32,807) Total Fixed Assets $68,453 $70,747 $82,413 $78,290 $56,093 Total Assets $112,910 $112,566 $124,368 $132,896 $124,743 $104,535 Accounts Payable $6.320 $6,125 $8, 160 $6,757 $7,662 Current Debt $6.950 $19,428 $17,246 $18,773 $19,102 $18,245 Total Current Liabilities $13,270 $25,553 $25,406 $27,189 $25,859 Long Term Debt $34,750 $32,333 $34,750 $37,834 $37,332 $25,338 Total Liabilities $48,020 $57,885 $60,156 $63,190 $51,245 Common Stock $23,360 $19,945 Retained Earnings $41,530 $34,736 $38,806 $34,930 Total Equity $54,681 Total Liabilities & Owners Equity $112,910 $112,566 $132,896 $124,743 $104,535 Income Statement Survey Baldwin Digby Ferris Sales $123,954 $110,307 $147,579 $152,663 $1 19,030 $ 138,820 Variable Costs(Labor, Material, Carry) $101,161 $82,391 Contribution Margin $42,217 $38,234 $46,418 $50,041 $36,639 Depreciation $7,587 $7.647 $7,707 $8.355 $5,927 SGA(R&D,Promo,Sales,Admin) $14,791 $17,091 $16,505 $19,331 $11,651 $18,506 Other(Fees, Writeoffs, TOM,Bonuses) $3,000 $109 $372 ($410) ($778) EBIT $16,840 $13,388 $22,805 $17,044 $20,728 Interest(Short term, Long term) $5,345 $6,336 $6,450 $6,948 Taxes $4.023 $2.468 $5.489 $3.534 Profit Sharing $149 $92 $204 $206 $131 $200 $7,322 $4,492 $6,431 $9,802 CAPSTONE @ COURIER Page 3 Production Analysis COURIER Round: 2 C121820_009 Dec. 31, 2022 Production Vs. Capacity C121820_009 Andrews Baldwin Chester Digby Erie Ferris 500 1,000 1.500 2.000 2.500 3,000 3.500 4,000 4.500 5.000 5.5002:12 4 aww3.capsim.com 37,507 37,047 37,TUT 37,035 cor'at SGA(R&D,Promo, Sales,Admin) $14,791 $17,091 $16,505 $11,651 $18,506 Other(Fees,Writeoffs, TOM,Bonuses) $3,000 $109 $72 $372 ($410) ($778) $16,840 $22,133 $22.805 $17.044 $20,728 $5,345 $6,336 $6.450 $6,950 $6,948 $5,341 4 of 15 $4.023 $2.468 $5.489 $5.549 $3.534 $5.386 $149 $92 $204 $206 $131 $200 $7,322 $4,492 $9,990 $10,099 $6,431 $9,802 CAPSTONE @ COURIER Page 3 Production Analysis COURIER Round: 2 C121820_009 Dec. 31, 2022 Production Vs. Capacity C121820_009 Baldwin Chester Digby Erie Ferris 500 1,000 1,500 2.000 2,500 3.000 3.500 4.000 4,500 5,000 5.500 O Capacity O Production Primary Revision Age Pfmn Size Material Cost Labor Contr. Next Plant Sold Date Dec.31 MTBF Price Cost Marg. Round Round 62 37% 4.0 1,800 1.782 0 5/24/2016 1.9 17500 13.6 $29.0 3.0 17.0 $19.50 $7.60 9.5 $38.00 $6.29 $7.20 29% 1,400 127% 570 0 12/2/2022 0 8/29/2022 $15.11 8.69 0% 3.0 3.0 900 600 54% 439 0 8/29/2022 1.6 19000 $13.34 $8.69 36% 0% 3.0 600 64% 979 237 1.8 17000 13.5 $29.00 6.38 17.05 39% 0% 5.0 1.300 132 12/18/2022 1.2 $16.26 $11.18 35% 7127/2022 9.40 30% 3.0 9/18/2022 1.7 22000 16000 62 $13.29 511.26 36% 0% 3.0 .28238 88928 8/26/2022 1.9 6.6 1200 1.3 23000 17.0 $19.5 32% 35% 5.5 11/15/2022 9/10/2022 1.5 27000 10.2 9.8 $37.5 11.8 13.9 $32.5 31%% 1.6 17000 32% 1.8 6.8 3.0 13.3 $29.0 17.0 37 %% 5.0 11/13/2022 10.2 11/13/2022 2700 259% 8/9/2023 1.5 19000 0.0 5.8 0.0 8.6 $34.0 0.0 8 38 883 1/15/2022 2.1 SS 4/22/2022 14000 13000 5.5 14.5 $29.0 11/11/2022 25000 9.0 $39.00 898382 $8 88 8_858 888838 88838 8888 CAPSTONE @ COURIER Page 4 Traditional Segment Analysis COURIER C121820_009 Round: 2 Dec. 31, 2022 Traditional Statistics Accessibility C121820_009 Traditional Total Industry Unit Demand 8,809 Actual Industry Unit Sales 18,809 Andrews Segment % of Total Industry 130.4% Baldwin Chester Traditional Customer Buying Criteria Digby Expectations Importance 1. Age deal Age = 2.0 47% Erie 2. Price $19.00 - 29.00 23% Ferris 3. Ideal Position Pfmn 6.4 Size 13.6 21% 4. Reliability MTBF 14000-19000 9% 60% 100% Perceptual Map for Traditional Actual vs Potential Market Share Perceptual map (at end of this year) 2022 C121820_009 Traditional 18 30% 16 25%% 142:12 14 aww3.capsim.com 5 of 15 Page 4 Traditional Segment Analysis COURIER C121820_009 Round: 2 Dec. 31, 2022 Traditional Statistics Accessibility C121820_009 Traditional Total Industry Unit Demand 8,809 Actual Industry Unit Sales 18,809 Andrews Segment % of Total Industry 130.4% Baldwin Next Year's Segment Growth Rate 19.2% Chester Traditional Customer Buying Criteria Digby Expectations Importance 1. Age Ideal Age = 2.0 47% Erie 2. Price $19.00 - 29.00 23% Ferri 3. Ideal Position Pfmn 6.4 Size 13.6 21% 4. Reliability MTBF 14000-19000 9% 40% 60% 100% Perceptual Map for Traditional Perceptual map (at end of this year) Actual vs Potential Market Share 20 2022 C121820_009 Traditional 18 30% 18 25% 14 20% 12 15% 10 10% 5% 0% Andrews Baldwin Chester Digby Ferris 0 2 4 6 8 10 12 14 16 18 20 O Actual Potential Performance Top Products in Traditional Segment Units Cust. Cust. Dec. Market Sold to Revision Stock Pfmn Size List Age Promo Aware- Sales Access- Cust Name Share Seg Date Out Coord Coord Price MTBF Dec.31 Budget ness Budget ibility Survey Eat 17% 1,497 4/8/2022 5.5 14.5 $27.00 15500 2.09 $1,050 57% $1,085 85% 35 Daze 15% 1,351 8/22/2022 6.8 13.3 $29.00 18100 1.84 $1,100 58% $1.440 70% Able 15% 1.332 7/21/2022 6.4 13.6 $29.00 17500 1.94 $1,100 61% $1.374 64% 39 Cake 15% 1.279 8/26/2022 6.4 13.6 $26.50 14000 1.87 $1,100 58% $1.270 64% 37 Echo 14% 1.239 7/20/2022 6.4 13.6 $27.00 16000 1.40 $1,050 54% $775 85% 34 Fast 13% 1,128 4/22/2022 5.5 14.5 $29.00 14000 2.08 $900 56% $1.235 65% 26 Bake 11% 979 12/5/2022 6.5 13.5 $29.00 17000 1.76 $1,300 60% $1.418 82% 40 Bead 0% 5/24/2016 30 17.0 $21.00 14000 6.60 $1,300 29% $1,418 82% CAPSTONE @ COURIER Page 5 Low End Segment Analysis COURIER C121820_009 Round: 2 Dec. 31, 2022 Low End Statistics Accessibility C121820_009 Low End Total Industry Unit Demand 11,180 Actual Industry Unit Sales |11,180 Andrews Segment % of Total Industry 138.6% Baldwin Next Year's Segment Growth Rate |11.7% Chester Low End Customer Buying Criteria Digby Expectations Importance Erie 1. Price $14.00 - 24.00 53% 2. Age Ideal Age = 7.0 24% Ferris 3. Ideal Position Pfmn 2.7 Size 17.3 16% 4. Reliability MTBF 12000-17000 7% 60% 80% 100% Perceptual Map for Low End 20 Perceptual map (at end of this year) Actual vs Potential Market Share 2022 C 121820_009 Low End 20% 18 18% 16 16% 14 14%2:12 14 aww3.capsim.com 6 of 15 Page 5 Low End Segment Analysis COURIER C121820_009 Round: 2 Dec. 31, 2022 Low End Statistics Accessibility C121820_009 Low End Total Industry Unit Demand 11,180 Actual Industry Unit Sales (11,180 Andrews Segment % of Total Industry 138.6% Baldwin Next Year's Segment Growth Rate [11.7% Chester Low End Customer Buying Criteria Digby Expectations Importance 1. Price $14.00 - 24.00 53% Erie 2. Age Ideal Age = 7.0 24% Ferris 3. Ideal Position Pimn 2.7 Size 17.3 16% 4. Reliability MTBF 12000-17000 7% 60% 80% 100% Perceptual Map for Low End Actual vs Potential Market Share 20 Perceptual map (at end of this year) 2022 C 121820_009 Low End 20% 18 18% 16 16% 14 14% 12% 12 10% 10 8% 6% 4% Andrews Chester Digby Ferris 0 2 4 6 8 10 12 14 18 18 20 O Actual Potential Performance Top Products in Low End Segment Units Cust. Cust Dec. Market Sold to Revision Stock Pfmn Size List Age Promo Aware- Sales Access- Cust Name Share Seg Date Out Coord Coord Price MTBF Dec.31 Budget ness Budget ibility Survey Cedar 19% 2,153 1/29/2021 3.0 17.0 $19.50 12000 6.60 $1,100 57% $1,333 60% 27 Ebb 18% 2.039 1/15/2022 30 17.0 $19.50 12000 6.60 $1,050 56% $1,085 54% 26 Bead 17% 1.928 5/24/2016 3.0 17.0 $21.00 14000 6.60 $1,300 59% $1.418 64% 24 Acre 16% 1,781 5/24/2016 YES 3.0 17.0 $19.50 14000 6.60 $1,100 60% $1.260 55%% 29 Dell 16% 1,772 5/24/2016 3.0 17.0 $21.50 14000 6.60 $1,100 57% $1,512 65% 23 Feat 13% 1.464 7/27/2025 3.0 17.0 $22.00 13000 6.60 $1,100 57% $1.235 59%% 19 Eat 0% 29 4/8/2022 55 14.5 $27.00 15500 2.09 $1,050 29% $1,085 54% Cake 0% 14 8/26/2022 BA 13.6 $26.50 14000 1.87 $1,100 29% $1,270 60% CAPSTONE & COURIER Page 6 High End Segment Analysis COURIER C121820_009 Round: 2 Dec. 31, 2022 High End Statistics Accessibility C121820_009 High End Total Industry Unit Demand 3,448 Actual Industry Unit Sales 13,44 Andrews Segment % of Total Industry |11.9% Baldwin Next Year's Segment Growth Rate |16.2% Chester High End Customer Buying Criteria Digby Expectations Importance 1. Ideal Position Pfmn 10.7 Size 9.3 43% Erie 2. Age Ideal Age = 0.0 29% Ferris 3. Reliability MTBF 20000-25000 19% 4. Price $29.00 - 39.00 9% 0% 60 80% 100% Perceptual Map for High End Actual vs Potential Market Share 20 Perceptual map (at end of this year) 2022 C 121820_009 High End 18 16 20% 14 12\f2:12 4 ww3.capsim.com Dot 0% 1 1/13/2022 YES 11.8 13.9 $34.00 27000 1.47 $1,100 28% $1,368 69% Able 0% 7/21/2022 6.4 13.6 $29.00 17500 1.94 $1,100 31% $1,374 58% 8 of 15 CAPSTONE @ COURIER Page 7 Performance Segment Analysis COURIER C121820_009 Round: 2 Dec. 31, 2022 Performance Statistics Accessibility C121820_009 Performance Total Industry Unit Demand 2,74 Actual Industry Unit Sales 12,74 Andrews Segment % of Total Industry 19.5% Baldwin Next Year's Segment Growth Rate |19.8% Chester Performance Customer Buying Criteria Digby Expectations Importance 1. Reliability MTBF 22000-27000 43% Erie 2. Ideal Position Pfmn 11.4 Size 14.6 29% Ferris 3. Price $24.00 - 34.00 19% 4. Age Ideal Age = 1.0 9% 40% 60% 80% 100% Perceptual Map for Performance Actual vs Potential Market Share 20 Perceptual map (at end of this year) 2022 C 121820_009 Performance 18 25% 16 Fast Edge 20% 14 12 15% 10 10% 5% 0% Andrews Digby Ferris 0 2 4 6 8 10 12 14 16 18 20 O Actual Potential Performance Top Products in Performance Segment Units Cust. Cust. Dec. Market Sold to Revision Stock >fmn Size List Age Promo Aware- Sales Access- Cust Name Share Seg Date Out Coord Coord Price MTBF Dec.31 Budget ness Budget ibility Survey Dot 27% 754 11/13/2022 YES 11.8 13.9 $34.00 27000 1.47 $1,100 57% $1,368 61% 40 Coat 26% 724 1 1/3/2022 YES 11.8 13.9 $32.50 27000 1.48 $1,000 56% $1.206 55% 40 Foam 26% 719 11/11/2022 YES 11.8 14.2 $34.00 27000 1.47 $1,100 57% $1.235 57% 40 Aft 15% 404 8/29/2022 YES 11.4 14.6 $34.00 25000 1.66 $940 59% $973 48% 25 Bold 3% 88 7/27/2022 8.8 13.5 $34.00 22000 1.67 $1,300 38% $681 25% 2 Edge 2% 58 6/30/2018 YES 9.4 15.5 $34.00 25000 4.50 $300 46% $155 19% Daze 0% 8/22/2022 13.3 $29.00 18100 1.84 $1,100 29% $1.440 61% CAPSTONE @ COURIER Page 8 Size Segment Analysis COURIER C121820_009 Round: 2 Dec. 31, 2022 Size Statistics Accessibility C121820_009 Size Total Industry Unit Demand 2,776 Actual Industry Unit Sales 12,776 Andrews Segment % of Total Industry 19.6% Baldwin Next Year's Segment Growth Rate |18.3% Chester Size Customer Buying Criteria Digby Expectations Importance 1. Ideal Position fmn 5.4 Size 8.6 43% Erie 2. Age Ideal Age = 1.5 29% Ferris 3. Reliability MTBF 16000-21000 19% 4. Price $24.00 - 34.00 9% 60% 100% Perceptual Map for Size Actual vs Potential Market Share 20 Perceptual map (at end of this year) 2022 C121820_009 Size 18 25% 162:13 14 aww3.capsim.com CAPSTONE @ COURIER Page 8 9 of 15 Size Segment Analysis COURIER C121820_009 Round: 2 Dec. 31, 2022 Size Statistics Accessibility C121820_009 Size Total Industry Unit Demand 2,776 Actual Industry Unit Sales 12.776 Andrews Segment % of Total Industry 19.6% Baldwin Next Year's Segment Growth Rate 18.3% Chester Size Customer Buying Criteria Digby Expectations Importance 43% Erie 1. Ideal Position Pfmn 5.4 Size 8.6 Ideal Age = 1.5 29% Ferris 3. Reliability MTBF 16000-21000 19% 4. Price $24.00 - 34.00 9% 40% 60% 80 Perceptual Map for Size Perceptual map (at end of this year) Actual vs Potential Market Share 20 2022 C121820_009 Size 18 25% 18 20% 14 15% 12 10 10% 5% 0% Ferris 6 8 10 12 14 16 18 20 O Actual Potential Performance Top Products in Size Segment Units Cust. Cust. Dec. Sold to Revision Stock Pfmn Size Age Promo Aware- Sales Access- Share Seg Date Out Coord Price MTBF Dec.31 Budget ness Survey Fume 25% 11/9/2022 YES 5.4 8.4 $34.00 19000 1.48 $1,100 57% $1.235 59% 44 Dune 25% 694 1 1/13/2022 YES 5.8 8.6 $34.00 19000 1.50 $1,100 57% 63% 43 Cure 25% 9/10/2022 YES 54 $32.50 17000 1.56 $1.000 56% $1.206 57% 38 Agape 16% 439 8/29/2022 YES 5.4 86 $34.00 19000 1.59 $1,040 57% $973 55% 43 Buddy 184 9/18/2022 6.2 $34.00 16000 $1,300 36% $737 Egg 2% 58 12/24/2022 6.9 $34.00 19000 2.30 $1,050 35% $775 Echo 0% 11 7/20/2022 6.4 13.6 $27.00 16000 $1,050 $775 Daze 0% 6.8 13.3 $29.00 18100 1.84 $1,100 29% $1.440 63% Able 0% 7/21/2022 6.4 13.6 $29.00 17500 1.94 $1,100 31% $1.374 55% Cake BA 13.6 $26.50 14000 1.87 $1.100 29% $1,270 57% CAPSTONE . COURIER Page 9 Market Share COURIER Round: 2 C121820_009 Dec. 31, 2022 Units Sold vs Demand Chart C121820_009 Market Share C121820_009 10,000 30% 8,000 20% 6,000 10% 4,000 0% 2.000 Trad Low High Pfmn Size Andrews Baldwin Digby Ferris Industry Unit Sales Total Unit Demand Low O High O Pfmn O Size Actual Market Share in Units Potential Market Share in Units Trad Low Total Pfmn Size Total Industry Unit Sales 8,809 11,180 28,961 Units Demanded 8,809 11,180 2,776 28,961 % of Market 30.4% 38.6% 11.9% 9.5% 9.6% 100.0% % of Market 30.4% 38.6% 11.9% 9.5%% 9.6% 100.0% Able 15.1% 0.2% 15.1% 0.2% 4.6% 19.7% 16.5% 2.0% 17.5% 2.1% Aft 14.7% 1.4% Aft 17.4% 1.6%% 15.8% 24.5% 2.4%% Agap Total 15.1% 15.9% 16.7% 14.7% 15.9% 15.7% 15.1% 19.7% 17.4% 24.6% 18.3% 11.1% 11.1% 3.4% 17 2% 16.5% 6.4% 20.1% 2.4% Bid 19.9% 3.2%% 0.8% 2.8% 0.5% Total 11.1% 17.2% 3.2% 6.6% 11.1% 16.5% 24.2% 2.8% 0.1% 4.5% 4.5% 18.4% 7.1% 19.3% 2.3%2:13 14 aww3.capsim.com Cake 0% 8/26/2022 6.4 13.6 $26.50 14000 1.87 $1,100 29% $1.270 57% 10 of 15 CAPSTONE @ COURIER Page 9 Market Share COURIER Round: 2 C121820_009 Dec. 31, 2022 Units Sold vs Demand Chart C121820_009 Market Share C121820_009 10,000 30% 8,000 20% 6,000 10% 4.000 0% 2.000 Trad Low High Pfmn Size Andrews Baldwin Digby Ferris Industry Unit Sales Total Unit Demand Trad Low O High O Pfmn O Size Actual Market Share in Units Potential Market Share in Units Trad Low Size Total Trad Low High Pfmn Size Total Industry Unit Sales 8,809 11,180 2,749 2,776 28,961 Units Demanded 8,809 11.180 3,448 2,749 2,776 28,961 % of Market 30.4% 38.6% 11.9% 9.5% 9.6% 100.0% % of Market 30.4% 38.6% 11.9% 9.5% 9.6% 100.0% Able 15.1% 0.2% 4.6% Able 15.1% 0.2% 4.6% 15.9% 19.7% 7.6% Adam 16.5% 2.0% 17.5% 2.1% Aft 14.7% 1.4% Aft 17.4% 1.6% Agap 15.8% 1.5%% Agape 24.5% 2.4% Total 15.1% 15.9% 16.7% 14.7% 15.9% 15.7% 15.1% 19.7% 17.7% 17.4% 24.6% 18.3% Baker 11.1% 11.1% 3.4% 17 2% 6.7% Bead 16.5% 6.4% Bid 20.1% 19.9% 2.4% Bold 3.29 0.8% Bold 2.8% 0.7% 0.4% 6.6% 0.7% Buddy 0.4% 5.1% 0.5% Total 1 1.1% 17.2% 24.5% 3.2% 6.6% 13.9% Total" 11.1% 16.5% 24.2% 2.8% 5.1% 13.4% Cake 14.5% 0.1% 4.5% Cake 14.5% 4.5% 19.3% 7.4% 18.4% 7.1% 19.5% 2.3% Cid 19.3% 2.3% Cost 0.3% 26.4% 25% Coat 0.2% 24.6% 2.4% Cure 24.7% 23.0% 14.5% 19.4% 19.8% 26.4% 24.7% 2.4% Cure 19.1% 14.5% 18.5% 19.5% 24.6% 23.1% 18.4% Daze 15.3% 0.7% 4.8% Daze 0.7% 4.8% 15 8% 6.1% Dell 15.3% 15.2% 5.9% 18.6% 18.4% 2.2% 0.2% 0.2% 24.0% 2.3% Dune 27.4% 2.6% Dot 25.0% 2.4% Dune 21.9% 2.1% 15.3% 15.8% 19.6% 27.5% 25.1% 18.1% Total 15.3% 15.2% 19.3% 24.0% 22.0% 17.2% 17.0% 0.3% 17.0% 0.26 5.3%% 18.2% 70% Ebb 17.4% 6.7% Echo 14.1% 0.4% 0.4% 4.4% Echo 14.1% 0.4% 0.4% 4.4% Edge 2.1% 7.6% 0.7% 0.2%% Egg 0.2%% 31.1% 18.5% 0.4% 2.1% 2 5% 17.1%% 31.1% 17.7% 0.4% 7.6% 2.2% 17.3% 12.8% 3.9% Fast 12.8% 3.9% 13.1% 5.1% 12.5% 4.8% 2.2 Foam 19.1% 2.3% 18.8% 26.2% 2.5% 23.7% 2.3%% 25.1% 24% Fume 23.0% 2.2%% 12.8% 13.1% 19.1% 26.2% 25.1% 16.1% 12 8% 12.5% 18.9% 23.7% 22.9% 15.4% CAPSTONE & COURIER Page 10 Perceptual Map COURIER Round: 2 C121820_009 Dec. 31, 2022 Perceptual Map for All Segments 20 Perceptual map (at end of this year) 18 16 Edge 14 12 Size 102:13 aww3.capsim.com 12 of 15 2 2 6 8 10 18 20 Performance Andrews Baldwin Chester Pfmn Size Revised Name Size Revised Name Pfmn Size 13.6 6.5 13.5 Cake 6.4 13.6 8/26/2022 Acre 3.0 170 3.0 17.0 5/24/2016 Cedar 3.0 17.0 Adam 10.2 95 12/2/2022 Bid 10.4 9.6 Cid 10.2 9.8 11.4 14.6 8/29/2022 Bold 13.5 7/27/2022 Coat 11.8 13.9 11/3/2022 11.4 9/18/2022 Cure Digby Erie Ferris Name Pfmn Size Revised Name Pfmn Size Daze 6.8 13.3 8/22/2022 Eat 5.5 14.5 4/8/2022 Fast 5.5 14.5 4/22/2022 3.0 17.0 5/24/2016 Ebb 3.0 17.0 1/15/2022 3.0 170 Duck 10.2 7/20/2022 10.2 98 12/22/2022 Dot 11.8 13.9 11/13/2022 Edge 15.5 6/30/2018 Foam 11.8 14.2 Dune 58 86 11/13/2022 Egg 69 13.4 12/24/2022 Fume 54 8.4 11/9/2022 Fox 110 90 12/12/2022 CAPSTONE @ COURIER HR/TQM Report COURIER Round: 2 C121820_009 Dec. 31, 2022 HUMAN RESOURCES SUMMARY Needed Complement 671 635 785 1st Shift Complement 618 677 524 2nd Shift Complement 201 Overtime Percent 0.0% 0.0% 0.0% 0.0%% 0.0%% 0.0% Turnover Rate 9.6% 3.8% 9.0% 8 8% 9.0% 8.8% Separated Employees $2.000 $2,000 $2.200 $2,000 $2.500 Training Hours 10 30 00.0% 100.9% 100.2% 101.2% 100.0% 101.4% $65 $168 $412 $714 $218 $588 Separation Cost $210 $433 Training Cost $134 $381 $413 $506 $362 $471 Total HR Admin Cost $409 $982 $825 $581 Labor Contract Next Year $23.15 $23.15 $23.15 $23.15 $23.15 2.500 2.500 2.500 2.500 2.500 Profit Sharing 2.0% 2.0% 2.0% 2.0% 2.0% Annual Raise 5.0% 5.0% 5.0% 5.0% 5.0% 5.0% Starting Negotiation Position Annual Raise Ceiling Negotiation Position Wages Benefits Annual Raise Adjusted Labor Demands Wages Annual Raise TOM SUMMARY Baldwin Chester Erie Ferris Process Mgt Budgets Last Year $1,000 SO VendorJIT SO Quality Initiative Training 1.000 SO so SO Channel Support Systems SO SO SO SO SO SO 86868 UNEP Green Programs SO SO SO SO SO TOM Budgets Last Year $0 $0 SO Quality Function Deployment Effort SO SO SO SO So SO CCE/6 Sigma Training 1,000 SO GEMI TOEM Sustainability Initiatives SO SO SO SO Cumulative Impacts Material Cost Reduction 1.51% 0.00% 0.02% 0.02% 0.00% 0.00% 0.09% 0.80% 0.00% Reduction R&D Cycle Time 0.00% 0.00% 0.00% 0.00% Reduction Admin Costs 0.00% 0.00% 0.00% 0.00% Demand Increase 0.01% 0.00% 0.00%

Step by Step Solution

There are 3 Steps involved in it

Step: 1

blur-text-image

Get Instant Access to Expert-Tailored Solutions

See step-by-step solutions with expert insights and AI powered tools for academic success

Step: 2

blur-text-image

Step: 3

blur-text-image

Ace Your Homework with AI

Get the answers you need in no time with our AI-driven, step-by-step assistance

Get Started

Recommended Textbook for

Essentials of Marketing Research

Authors: Barry J. Babin, William G. Zikmund

6th edition

9781305688094, 1305263472, 1305688090, 978-1305263475

More Books

Students also viewed these Marketing questions