 I need help on tootsie roll Industries Inc. I have the spread sheet done but need help with the following snips. The gross profit percent, return on sales and the earnings pershare, price earning ratio and dividend yield. It says to find them on the internet but I dont know where too look.
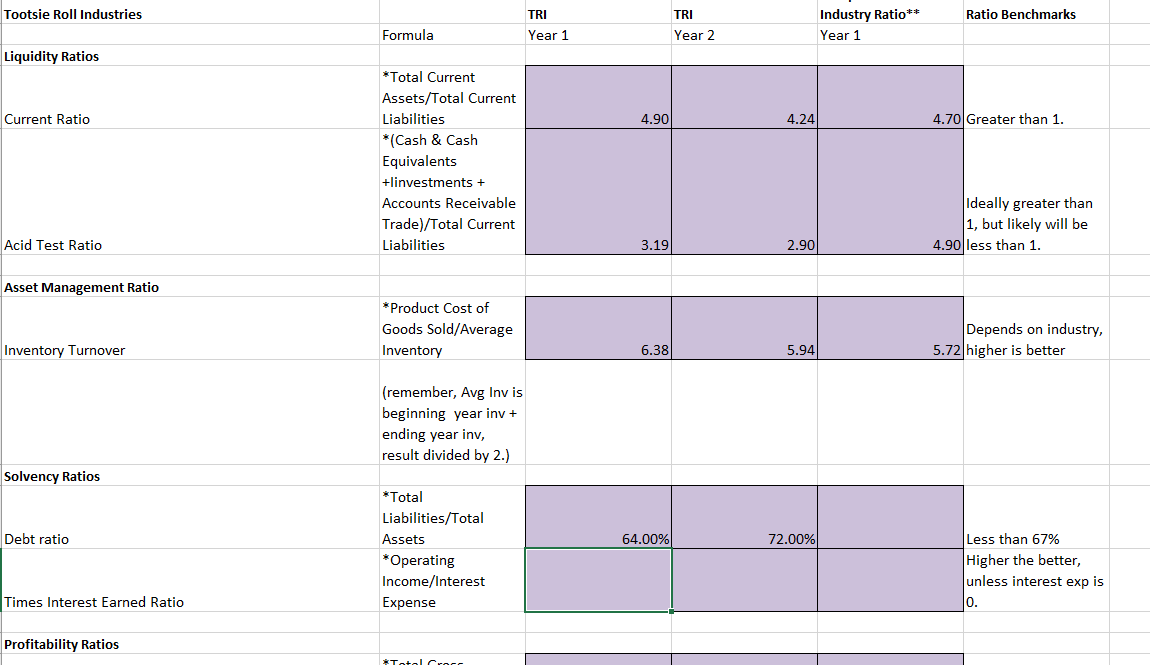
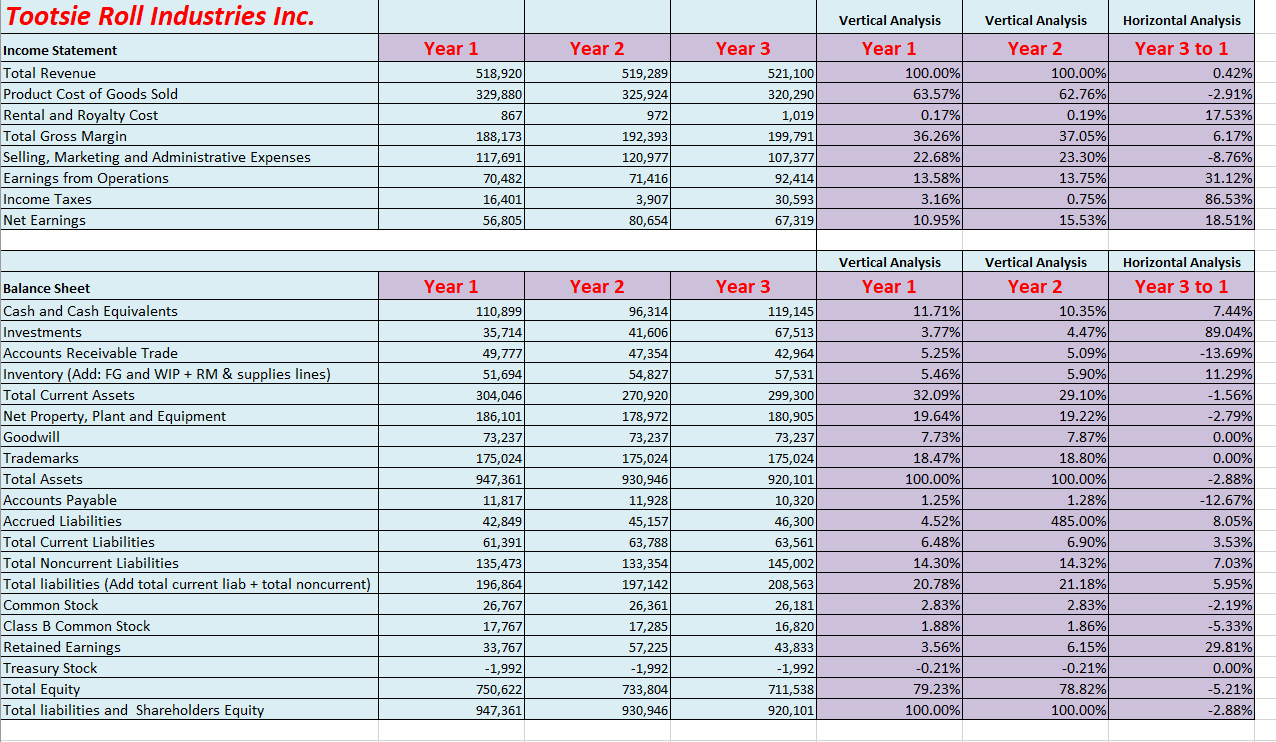
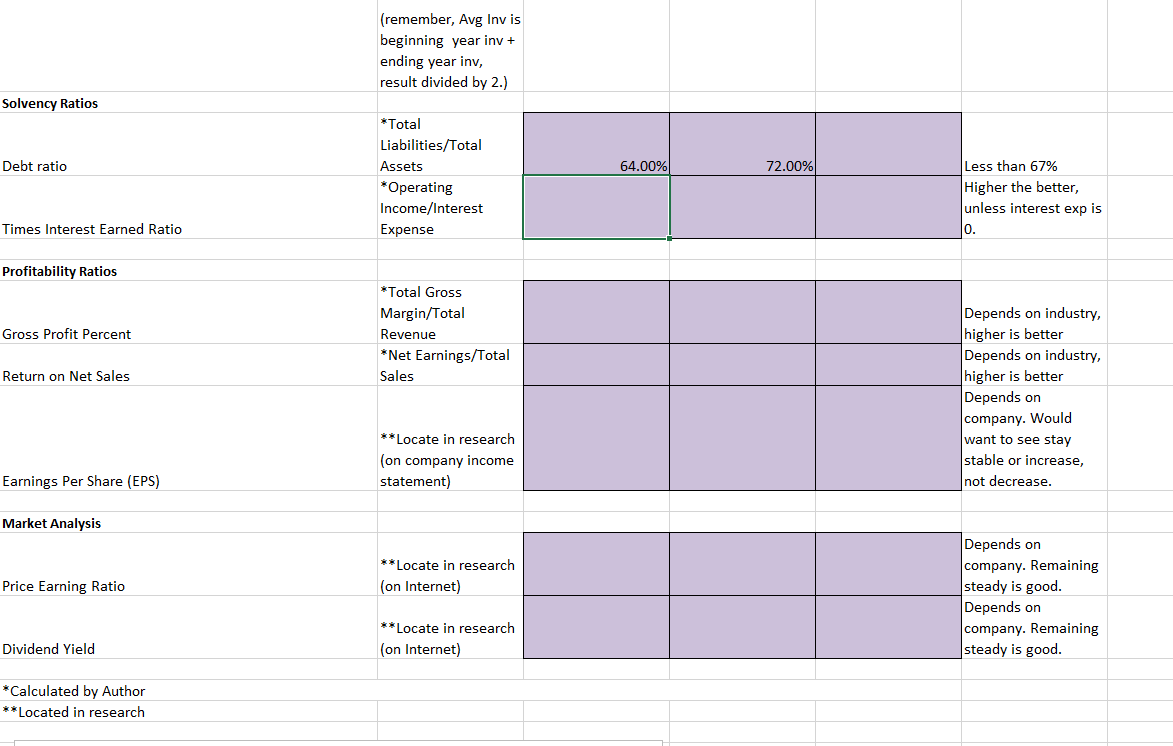
Tootsie Roll Industries Ratio Benchmarks TRI Year 1 TRI Year 2 Industry Ratio** Year 1 Formula Liquidity Ratios Current Ratio 4.90 4.70 Greater than 1. *Total Current Assets/Total Current Liabilities * (Cash & Cash Equivalents +linvestments + Accounts Receivable Trade)/Total Current Liabilities Ideally greater than 1, but likely will be 4.90 less than 1. Acid Test Ratio 3.19 2.90 Asset Management Ratio *Product Cost of Goods Sold/Average Inventory Depends on industry, 5.72 higher is better Inventory Turnover (remember, Avg Invis beginning year inv + ending year inv, result divided by 2.) Solvency Ratios Debt ratio 64.00% 72.00% *Total Liabilities/Total Assets *Operating Income/Interest Expense Less than 67% Higher the better, unless interest exp is Times Interest Earned Ratio Profitability Ratios Totalcroce Tootsie Roll Industries Inc. Income Statement Total Revenue Product Cost of Goods Sold Rental and Royalty Cost Total Gross Margin Selling, Marketing and Administrative Expenses Earnings from Operations Income Taxes Net Earnings Year 1 518,920 329,880 867 188,173 117,691 70,482 16,401 56,805 Year 2 519,289 325,924 972 192,393 120,977 71,416 3,907 80,654 Year 3 521,100 320,290 1,019 199,791 107,377 92,414 30,593 67,319 Vertical Analysis Year 1 100.00% 63.57% 0.17% 36.26% 22.68% 13.58% 3.16% 10.95% Vertical Analysis Year 2 100.00% 62.76% 0.19% 37.05% 23.30% 13.75% 0.75% 15.53% Horizontal Analysis Year 3 to 1 0.42% -2.91% 17.53% 6.17% -8.76% 31.12% 86.53% 18.51% Balance Sheet Cash and Cash Equivalents Investments Accounts Receivable Trade Inventory (Add: FG and WIP + RM & supplies lines) Total Current Assets Net Property, Plant and Equipment Goodwill Trademarks Total Assets Accounts Payable Accrued Liabilities Total Current Liabilities Total Noncurrent Liabilities Total liabilities (Add total current liab + total noncurrent) Common Stock Class B Common Stock Retained Earnings Treasury Stock Total Equity Total liabilities and Shareholders Equity Year 1 110,899 35,714 49,777 51,694 304,046 186,101 73,237 175,024 947,361 11,817 42,849 61,391 135,473 196,864 26,767 17,767 33,767 -1,992 750,622 947,361 Year 2 96,314 41,606 47,354 54,827 270,920 178,972 73,237 175,024 930,946 11,928 45,157 63,788 133,354 197,142 26,361 17,285 57,225 -1,992 733,804 930,946 Year 3 119,145 67,513 42,964 57,531 299,300 180,905 73,237 175,024 920,101 10,320 46,300 63,561 145,002 208,563 26,181 16,820 43,833 -1,992 711,538 920,101 Vertical Analysis Year 1 11.71% 3.77% 5.25% 5.46% 32.09% 19.64% 7.73% 18.47% 100.00% 1.25% 4.52% 6.48% 14.30% 20.78% 2.83% 1.88% 3.56% -0.21% 79.23% 100.00% Vertical Analysis Year 2 10.35% 4.47% 5.09% 5.90% 29.10% 19.22% 7.87% 18.80% 100.00% 1.28% 485.00% 6.90% 14.32% 21.18% 2.83% 1.86% 6.15% -0.21% 78.82% 100.00% Horizontal Analysis Year 3 to 1 7.44% 89.04% -13.69% 11.29% -1.56% -2.79% 0.00% 0.00% -2.88% -12.67% 8.05% 3.53% 7.03% 5.95% -2.19% -5.33% 29.81% 0.00% -5.21% -2.88% (remember, Avg Invis beginning year inv + ending year inv, result divided by 2.) Solvency Ratios Debt ratio 64.00% 72.00% *Total Liabilities/Total Assets *Operating Income/Interest Expense Less than 67% Higher the better, unless interest exp is Times Interest Earned Ratio Profitability Ratios Gross Profit Percent *Total Gross Margin/Total Revenue *Net Earnings/Total Sales Return on Net Sales Depends on industry, higher is better Depends on industry, higher is better Depends on company. Would want to see stay stable or increase, not decrease. **Locate in research (on company income statement) Earnings Per Share (EPS) Market Analysis **Locate in research (on Internet) Price Earning Ratio Depends on company. Remaining steady is good. Depends on company. Remaining steady is good. **Locate in research (on Internet) Dividend Yield *Calculated by Author **Located in research Tootsie Roll Industries Ratio Benchmarks TRI Year 1 TRI Year 2 Industry Ratio** Year 1 Formula Liquidity Ratios Current Ratio 4.90 4.70 Greater than 1. *Total Current Assets/Total Current Liabilities * (Cash & Cash Equivalents +linvestments + Accounts Receivable Trade)/Total Current Liabilities Ideally greater than 1, but likely will be 4.90 less than 1. Acid Test Ratio 3.19 2.90 Asset Management Ratio *Product Cost of Goods Sold/Average Inventory Depends on industry, 5.72 higher is better Inventory Turnover (remember, Avg Invis beginning year inv + ending year inv, result divided by 2.) Solvency Ratios Debt ratio 64.00% 72.00% *Total Liabilities/Total Assets *Operating Income/Interest Expense Less than 67% Higher the better, unless interest exp is Times Interest Earned Ratio Profitability Ratios Totalcroce Tootsie Roll Industries Inc. Income Statement Total Revenue Product Cost of Goods Sold Rental and Royalty Cost Total Gross Margin Selling, Marketing and Administrative Expenses Earnings from Operations Income Taxes Net Earnings Year 1 518,920 329,880 867 188,173 117,691 70,482 16,401 56,805 Year 2 519,289 325,924 972 192,393 120,977 71,416 3,907 80,654 Year 3 521,100 320,290 1,019 199,791 107,377 92,414 30,593 67,319 Vertical Analysis Year 1 100.00% 63.57% 0.17% 36.26% 22.68% 13.58% 3.16% 10.95% Vertical Analysis Year 2 100.00% 62.76% 0.19% 37.05% 23.30% 13.75% 0.75% 15.53% Horizontal Analysis Year 3 to 1 0.42% -2.91% 17.53% 6.17% -8.76% 31.12% 86.53% 18.51% Balance Sheet Cash and Cash Equivalents Investments Accounts Receivable Trade Inventory (Add: FG and WIP + RM & supplies lines) Total Current Assets Net Property, Plant and Equipment Goodwill Trademarks Total Assets Accounts Payable Accrued Liabilities Total Current Liabilities Total Noncurrent Liabilities Total liabilities (Add total current liab + total noncurrent) Common Stock Class B Common Stock Retained Earnings Treasury Stock Total Equity Total liabilities and Shareholders Equity Year 1 110,899 35,714 49,777 51,694 304,046 186,101 73,237 175,024 947,361 11,817 42,849 61,391 135,473 196,864 26,767 17,767 33,767 -1,992 750,622 947,361 Year 2 96,314 41,606 47,354 54,827 270,920 178,972 73,237 175,024 930,946 11,928 45,157 63,788 133,354 197,142 26,361 17,285 57,225 -1,992 733,804 930,946 Year 3 119,145 67,513 42,964 57,531 299,300 180,905 73,237 175,024 920,101 10,320 46,300 63,561 145,002 208,563 26,181 16,820 43,833 -1,992 711,538 920,101 Vertical Analysis Year 1 11.71% 3.77% 5.25% 5.46% 32.09% 19.64% 7.73% 18.47% 100.00% 1.25% 4.52% 6.48% 14.30% 20.78% 2.83% 1.88% 3.56% -0.21% 79.23% 100.00% Vertical Analysis Year 2 10.35% 4.47% 5.09% 5.90% 29.10% 19.22% 7.87% 18.80% 100.00% 1.28% 485.00% 6.90% 14.32% 21.18% 2.83% 1.86% 6.15% -0.21% 78.82% 100.00% Horizontal Analysis Year 3 to 1 7.44% 89.04% -13.69% 11.29% -1.56% -2.79% 0.00% 0.00% -2.88% -12.67% 8.05% 3.53% 7.03% 5.95% -2.19% -5.33% 29.81% 0.00% -5.21% -2.88% (remember, Avg Invis beginning year inv + ending year inv, result divided by 2.) Solvency Ratios Debt ratio 64.00% 72.00% *Total Liabilities/Total Assets *Operating Income/Interest Expense Less than 67% Higher the better, unless interest exp is Times Interest Earned Ratio Profitability Ratios Gross Profit Percent *Total Gross Margin/Total Revenue *Net Earnings/Total Sales Return on Net Sales Depends on industry, higher is better Depends on industry, higher is better Depends on company. Would want to see stay stable or increase, not decrease. **Locate in research (on company income statement) Earnings Per Share (EPS) Market Analysis **Locate in research (on Internet) Price Earning Ratio Depends on company. Remaining steady is good. Depends on company. Remaining steady is good. **Locate in research (on Internet) Dividend Yield *Calculated by Author **Located in research