

Question
I need help only with F-H (A-E are completed in the excel table Below) 2. Cost of Capital and Optimal Capital Structure a. Using balance
I need help only with F-H (A-E are completed in the excel table Below)
2. Cost of Capital and Optimal Capital Structure
a. Using balance sheet book value of long-term debt and stockholders equity, calculate CHDs capital structure for E/V and D/V for the past two years.
b. Recalculate E/V and D/V using CHDs current market capitalization of stock in place of the book value of stockholders equity employed in part a.
c. Review the bond ratings and market yields to maturity of CHDs bonds from FINRA to estimate an approximate (long-term) RD in the current financial market environment.
d. Estimate CHDs required return on equity (i.e. RE) using the dividend discount model (i.e. D/P + g). You will need a dividend yield (e.g. Yahoo Finance) and an approximate growth rate. The analyst believes that CHDs rapid historical growth rates of DPS and EPS will remain strong but naturally slow down by about one-third going forward.
e. Estimate CHDs required return on equity using the CAPM. Note that it is a good idea to get multiple perspectives on beta. Assume the market risk premium is around 7%, but be aware that the risk-free rate is unsustainably low if measured by the 10-year US Treasury yield in todays market. Another consideration is that the analyst has seen CHD beta estimates from certain services that appear too low and plans to use an adjusted beta that increases the beta by one-third of its difference from a beta of one.
f. Using your judgment based on finance concepts and the information in parts d and e above, provide and justify a reasonable range for RE.
g. Put all the information from parts a-f above into calculations for a fair range of CHDs WACC and briefly explain your results in terms of whether these WACC rates fairly capture CHDs risk profile from your analysis in Parts 1 and 2 thus far.
h. Provide brief commentary based on your overall analysis of whether you believe that CHDs capital structure of debt versus equity weights is fairly optimal.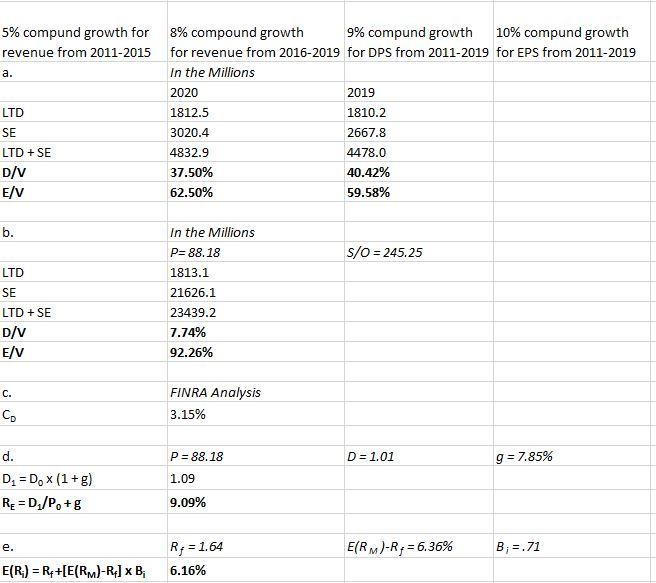
Step by Step Solution
There are 3 Steps involved in it
Step: 1

Get Instant Access to Expert-Tailored Solutions
See step-by-step solutions with expert insights and AI powered tools for academic success
Step: 2

Step: 3
Ace Your Homework with AI
Get the answers you need in no time with our AI-driven, step-by-step assistance
Get Started
Financial management theory and practice
Authors: Eugene F. Brigham and Michael C. Ehrhardt
12th Edition
978-0030243998, 30243998, 324422695, 978-0324422696