I need help putting the question numbers from the Balance Sheet and Income Sheet. The question have the formulas setup already just need to put in the numbers. Question is at the bottom of the pictures. Please see below.
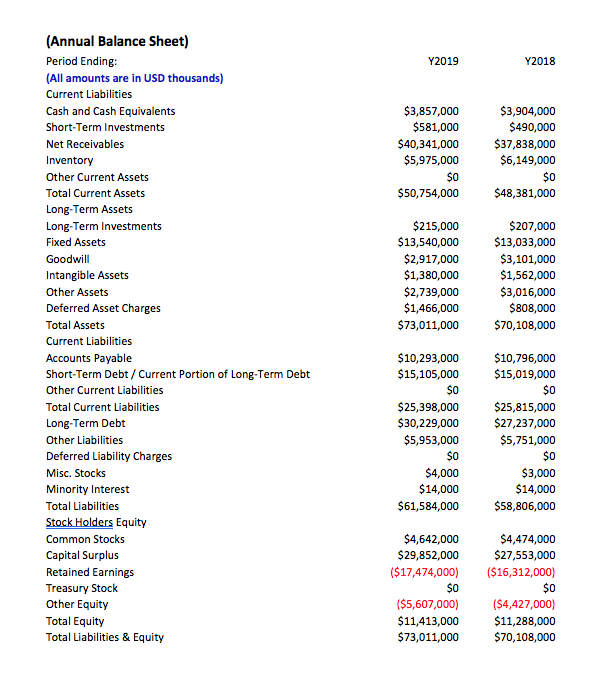
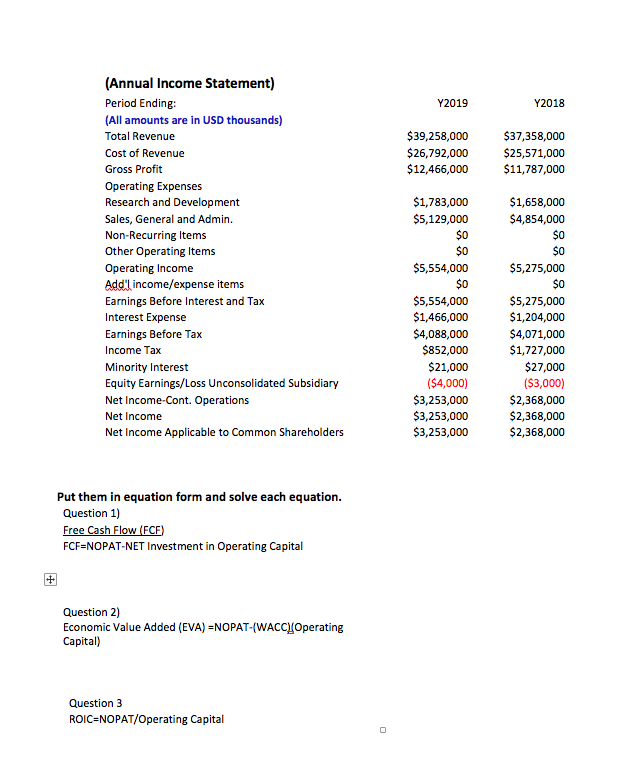
Y2019 Y2018 $3,857,000 $581,000 $40,341,000 $5,975,000 $0 $50,754,000 $3,904,000 $490,000 $37,838,000 $6,149,000 $0 $48,381,000 $215,000 $13,540,000 $2,917,000 $1,380,000 $2,739,000 $1,466,000 $73,011,000 $207,000 $13,033,000 $3,101,000 $1,562,000 $3,016,000 $808,000 $70,108,000 (Annual Balance Sheet) Period Ending: (All amounts are in USD thousands) Current Liabilities Cash and Cash Equivalents Short-Term Investments Net Receivables Inventory Other Current Assets Total Current Assets Long-Term Assets Long-Term Investments Fixed Assets Goodwill Intangible Assets Other Assets Deferred Asset Charges Total Assets Current Liabilities Accounts Payable Short-Term Debt / Current Portion of Long-Term Debt Other Current Liabilities Total Current Liabilities Long-Term Debt Other Liabilities Deferred Liability Charges Misc. Stocks Minority Interest Total Liabilities Stock Holders Equity Common Stocks Capital Surplus Retained Earnings Treasury Stock Other Equity Total Equity Total Liabilities & Equity $10,293,000 $15,105,000 $0 $25,398,000 $30,229,000 $5,953,000 $0 $4,000 $14,000 $61,584,000 $10,796,000 $15,019,000 $0 $25,815,000 $27,237,000 $5,751,000 $0 $3,000 $14,000 $58,806,000 $4,642,000 $29,852,000 ($17,474,000) $0 ($5,607,000) $11,413,000 $73,011,000 $4,474,000 $27,553,000 ($16,312,000) $0 ($4,427,000) $11,288,000 $70,108,000 Y2019 Y2018 $39,258,000 $26,792,000 $12,466,000 $37,358,000 $25,571,000 $11,787,000 (Annual Income Statement) Period Ending: (All amounts are in USD thousands) Total Revenue Cost of Revenue Gross Profit Operating Expenses Research and Development Sales, General and Admin. Non-Recurring Items Other Operating Items Operating Income Add'l income/expense items Earnings Before Interest and Tax Interest Expense Earnings Before Tax Income Tax Minority Interest Equity Earnings/Loss Unconsolidated Subsidiary Net Income-Cont. Operations Net Income Net Income Applicable to Common Shareholders $1,783,000 $5,129,000 $0 $0 $5,554,000 $0 $5,554,000 $1,466,000 $4,088,000 $852,000 $21,000 ($4,000) $3,253,000 $3,253,000 $3,253,000 $1,658,000 $4,854,000 $0 $0 $5,275,000 $0 $5,275,000 $1,204,000 $4,071,000 $1,727,000 $27,000 ($3,000) $2,368,000 $2,368,000 $2,368,000 Put them in equation form and solve each equation. Question 1) Free Cash Flow (FCE) FCFENOPAT-NET Investment in Operating Capital + Question 2) Economic Value Added (EVA) =NOPAT-(WACC(Operating Capital) Question 3 ROICENOPAT/Operating Capital Y2019 Y2018 $3,857,000 $581,000 $40,341,000 $5,975,000 $0 $50,754,000 $3,904,000 $490,000 $37,838,000 $6,149,000 $0 $48,381,000 $215,000 $13,540,000 $2,917,000 $1,380,000 $2,739,000 $1,466,000 $73,011,000 $207,000 $13,033,000 $3,101,000 $1,562,000 $3,016,000 $808,000 $70,108,000 (Annual Balance Sheet) Period Ending: (All amounts are in USD thousands) Current Liabilities Cash and Cash Equivalents Short-Term Investments Net Receivables Inventory Other Current Assets Total Current Assets Long-Term Assets Long-Term Investments Fixed Assets Goodwill Intangible Assets Other Assets Deferred Asset Charges Total Assets Current Liabilities Accounts Payable Short-Term Debt / Current Portion of Long-Term Debt Other Current Liabilities Total Current Liabilities Long-Term Debt Other Liabilities Deferred Liability Charges Misc. Stocks Minority Interest Total Liabilities Stock Holders Equity Common Stocks Capital Surplus Retained Earnings Treasury Stock Other Equity Total Equity Total Liabilities & Equity $10,293,000 $15,105,000 $0 $25,398,000 $30,229,000 $5,953,000 $0 $4,000 $14,000 $61,584,000 $10,796,000 $15,019,000 $0 $25,815,000 $27,237,000 $5,751,000 $0 $3,000 $14,000 $58,806,000 $4,642,000 $29,852,000 ($17,474,000) $0 ($5,607,000) $11,413,000 $73,011,000 $4,474,000 $27,553,000 ($16,312,000) $0 ($4,427,000) $11,288,000 $70,108,000 Y2019 Y2018 $39,258,000 $26,792,000 $12,466,000 $37,358,000 $25,571,000 $11,787,000 (Annual Income Statement) Period Ending: (All amounts are in USD thousands) Total Revenue Cost of Revenue Gross Profit Operating Expenses Research and Development Sales, General and Admin. Non-Recurring Items Other Operating Items Operating Income Add'l income/expense items Earnings Before Interest and Tax Interest Expense Earnings Before Tax Income Tax Minority Interest Equity Earnings/Loss Unconsolidated Subsidiary Net Income-Cont. Operations Net Income Net Income Applicable to Common Shareholders $1,783,000 $5,129,000 $0 $0 $5,554,000 $0 $5,554,000 $1,466,000 $4,088,000 $852,000 $21,000 ($4,000) $3,253,000 $3,253,000 $3,253,000 $1,658,000 $4,854,000 $0 $0 $5,275,000 $0 $5,275,000 $1,204,000 $4,071,000 $1,727,000 $27,000 ($3,000) $2,368,000 $2,368,000 $2,368,000 Put them in equation form and solve each equation. Question 1) Free Cash Flow (FCE) FCFENOPAT-NET Investment in Operating Capital + Question 2) Economic Value Added (EVA) =NOPAT-(WACC(Operating Capital) Question 3 ROICENOPAT/Operating Capital