

Answered step by step
Verified Expert Solution
Question
1 Approved Answer
I need help, the 2 excel spreadsheets are needed to answer question 5 H N 0 de were FINANCIAL STATEMENTS Balance Sheet Check 2011 OK
I need help, the 2 excel spreadsheets are needed to answer question 5
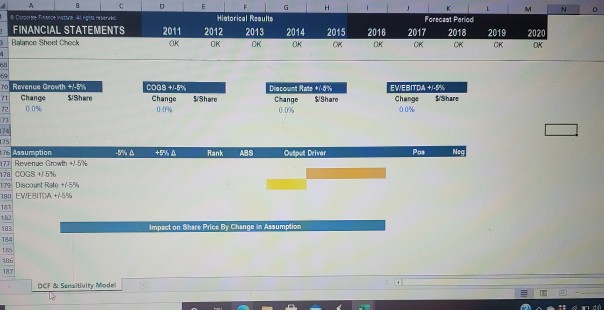
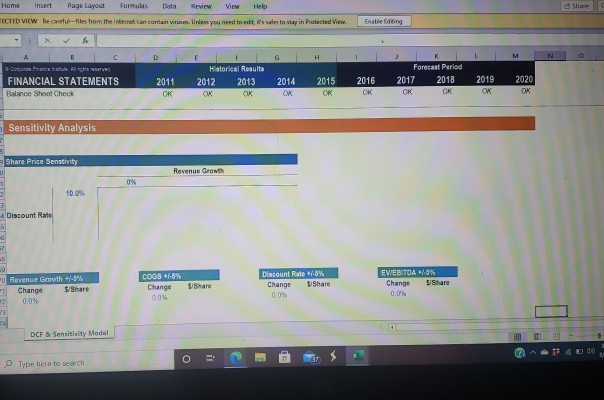
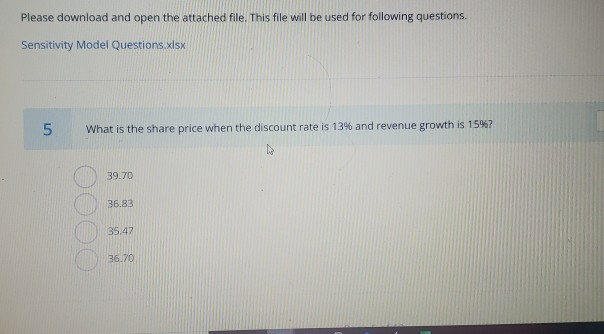
H N 0 de were FINANCIAL STATEMENTS Balance Sheet Check 2011 OK E Historical Results 2012 2013 OK OK 2015 2014 OK 2020 Forecast Period 2017 2018 OK 2016 OK 2019 OK OK OK 59 70 Revenue Growth +/-5% 71 Change $1Share R 2 0.0% 73 COGS +/-5% Change 0.01% Share Discount Rate +/-5% Change $ Share 0.0% EVEBITDA +/-5% Change S/Share 00% -0% +5% Rank ABS Output Driver Pos Neg 175 76 Assumption 77 Revenue Growth +-5% 178 COGS +5% 179 Discount Ro +-5% 790 EVEBITOM +/-5% 181 182 183 184 Impact on Share Price By Change in Assumption 185 187 DCF & Sensitivity Model TO Home Insert Page Layout Formulas Data Review View Help ECTED VIEW Be careful-Hiles from the Internet can contain vinne. Unless you need to dit is water to stay in Protected View Enable doing f D G H M Coro FINANCIAL STATEMENTS Balance Sheet Check 2015 Historical Results 2012 2013 OK OK 2011 OR 2014 OK 2016 Forecast Period 2017 2018 OK 2019 OK 2020 OK CK Sensitivity Analysis Share Price Senstivity Revenue Growth ON 10.046 Discount Rate -5 COGS +/-6% Change OON Discount Rate +/-5% Change $/Share 0.0% EWEBITDA 15% Change Share $/Share Revenue Growth +1-3% Change $ Share 0.0% 23 24 DCFX Sensitivity Model # D o il E Type here to search Please download and open the attached file. This file will be used for following questions. Sensitivity Model Questions.xlsx 5 What is the share price when the discount rate is 13% and revenue growth is 15%? 39.70 36.83 35.47 36.70 H N 0 de were FINANCIAL STATEMENTS Balance Sheet Check 2011 OK E Historical Results 2012 2013 OK OK 2015 2014 OK 2020 Forecast Period 2017 2018 OK 2016 OK 2019 OK OK OK 59 70 Revenue Growth +/-5% 71 Change $1Share R 2 0.0% 73 COGS +/-5% Change 0.01% Share Discount Rate +/-5% Change $ Share 0.0% EVEBITDA +/-5% Change S/Share 00% -0% +5% Rank ABS Output Driver Pos Neg 175 76 Assumption 77 Revenue Growth +-5% 178 COGS +5% 179 Discount Ro +-5% 790 EVEBITOM +/-5% 181 182 183 184 Impact on Share Price By Change in Assumption 185 187 DCF & Sensitivity Model TO Home Insert Page Layout Formulas Data Review View Help ECTED VIEW Be careful-Hiles from the Internet can contain vinne. Unless you need to dit is water to stay in Protected View Enable doing f D G H M Coro FINANCIAL STATEMENTS Balance Sheet Check 2015 Historical Results 2012 2013 OK OK 2011 OR 2014 OK 2016 Forecast Period 2017 2018 OK 2019 OK 2020 OK CK Sensitivity Analysis Share Price Senstivity Revenue Growth ON 10.046 Discount Rate -5 COGS +/-6% Change OON Discount Rate +/-5% Change $/Share 0.0% EWEBITDA 15% Change Share $/Share Revenue Growth +1-3% Change $ Share 0.0% 23 24 DCFX Sensitivity Model # D o il E Type here to search Please download and open the attached file. This file will be used for following questions. Sensitivity Model Questions.xlsx 5 What is the share price when the discount rate is 13% and revenue growth is 15%? 39.70 36.83 35.47 36.70Step by Step Solution
There are 3 Steps involved in it
Step: 1

Get Instant Access to Expert-Tailored Solutions
See step-by-step solutions with expert insights and AI powered tools for academic success
Step: 2

Step: 3
Ace Your Homework with AI
Get the answers you need in no time with our AI-driven, step-by-step assistance
Get Started
Professionals Handbook Of Financial Risk Management
Authors: Lev Borodovsky, Marc Lore
1st Edition
0750641118, 978-0750641111