

Answered step by step
Verified Expert Solution
Question
1 Approved Answer
I need help trying to create code for this project, if somebody could help that would be great 3. Create the following 3 data reports:
I need help trying to create code for this project, if somebody could help that would be great
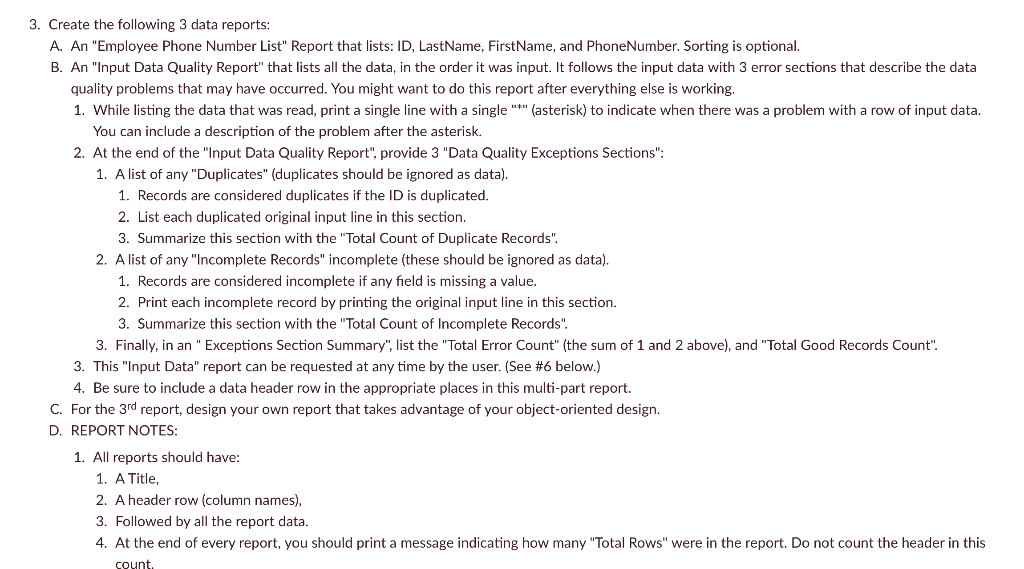
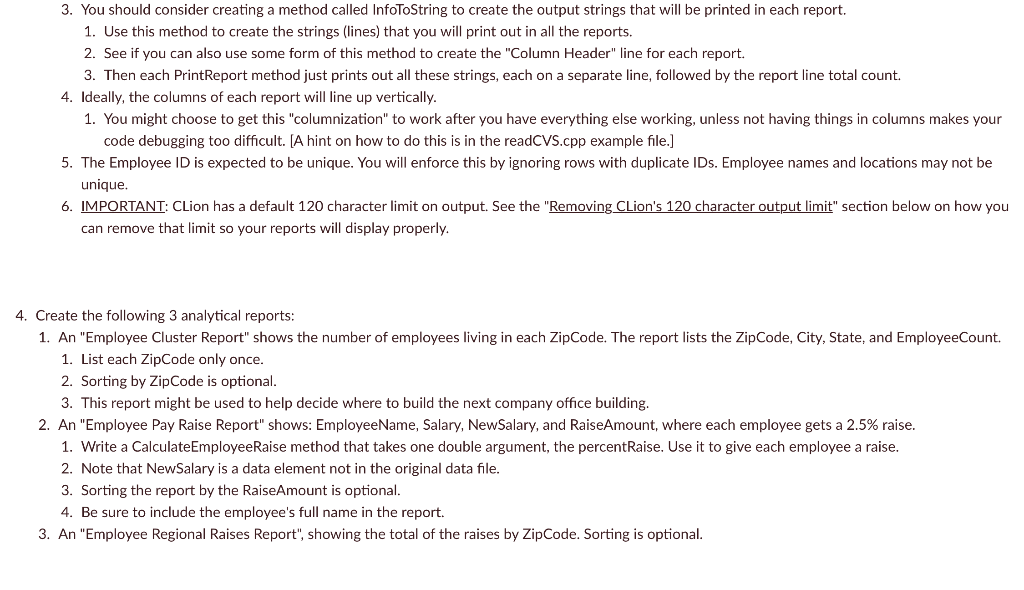
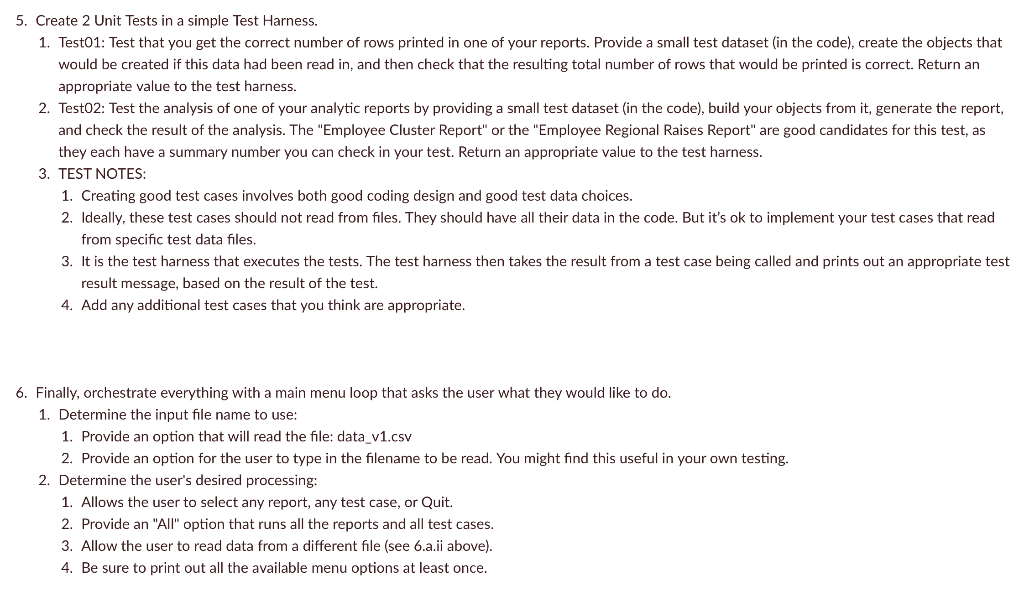
3. Create the following 3 data reports: A. An "Employee Phone Number List" Report that lists: ID, LastName, FirstName, and PhoneNumber. Sorting is optional. B. An "Input Data Quality Report" that lists all the data, in the order it was input. It follows the input data with 3 error sections that describe the data quality problems that may have occurred. You might want to do this report after everything else is working. 1. While listing the data that was read, print a single line with a single "*" (asterisk) to indicate when there was a problem with a row of input data. You can include a description of the problem after the asterisk. 2. At the end of the "Input Data Quality Report", provide 3 "Data Quality Exceptions Sections": 1. A list of any "Duplicates" (duplicates should be ignored as data). 1. Records are considered duplicates if the ID is duplicated. 2. List each duplicated original input line in this section. 3. Summarize this section with the "Total Count of Duplicate Records". 2. A list of any "Incomplete Records" incomplete (these should be ignored as data). 1. Records are considered incomplete if any field is missing a value. 2. Print each incomplete record by printing the original input line in this section. 3. Summarize this section with the "Total Count of Incomplete Records". 3. Finally, in an " Exceptions Section Summary", list the "Total Error Count" (the sum of 1 and 2 above), and "Total Good Records Count". 3. This "Input Data" report can be requested at any time by the user. (See #6 below.) 4. Be sure to include a data header row in the appropriate places in this multi-part report. C. For the 3rd report, design your own report that takes advantage of your object-oriented design. D. REPORT NOTES: 1. All reports should have: 1. A Title, 2. A header row (column names), 3. Followed by all the report data. 4. At the end of every report, you should print a message indicating how many "Total Rows" were in the report. Do not count the header in this count 3. You should consider creating a method called InfoToString to create the output strings that will be printed in each report. 1. Use this method to create the strings (lines) that you will print out in all the reports. 2. See if you can also use some form of this method to create the "Column Header" line for each report. 3. Then each PrintReport method just prints out all these strings, each on a separate line, followed by the report line total count. 4. Ideally, the columns of each report will line up vertically. 1. You might choose to get this "columnization" to work after you have everything else working, unless not having things in columns makes your code debugging too difficult. (A hint on how to do this is in the readCVS.cpp example file.] 5. The Employee ID is expected to be unique. You will enforce this by ignoring rows with duplicate IDs. Employee names and locations may not be unique 6. IMPORTANT: CLion has a default 120 character limit on output. See the "Removing CLion's 120 character output limit" section below on how you can remove that limit so your reports will display properly. 4. Create the following 3 analytical reports: 1. An "Employee Cluster Report" shows the number of employees living in each ZipCode. The report lists the Zip Code, City, State, and EmployeeCount. 1. List each ZipCode only once. 2. Sorting by ZipCode is optional. 3. This report might be used to help decide where to build the next company office building. 2. An "Employee Pay Raise Report" shows: EmployeeName, Salary, NewSalary, and RaiseAmount, where each employee gets a 2.5% raise. 1. Write a Calculate EmployeeRaise method that takes one double argument, the percentRaise. Use it to give each employee a raise. 2. Note that NewSalary is a data element not in the original data file. 3. Sorting the report by the RaiseAmount is optional. 4. Be sure to include the employee's full name in the report. 3. An "Employee Regional Raises Report", showing the total of the raises by ZipCode. Sorting is optional. 5. Create 2 Unit Tests in a simple Test Harness. 1. Test01: Test that you get the correct number of rows printed in one of your reports. Provide a small test dataset (in the code), create the objects that would be created if this data had been read in, and then check that the resulting total number of rows that would be printed is correct. Return an appropriate value to the test harness. 2. Test02: Test the analysis of one of your analytic reports by providing a small test dataset (in the code), build your objects from it, generate the report, and check the result of the analysis. The "Employee Cluster Report" or the "Employee Regional Raises Report" are good candidates for this test, as they each have a summary number you can check in your test. Return an appropriate value to the test harness. 3. TEST NOTES: 1. Creating good test cases involves both good coding design and good test data choices. 2. Ideally, these test cases should not read from files. They should have all their data in the code. But it's ok to implement your test cases that read from specific test data files. 3. It is the test harness that executes the tests. The test harness then takes the result from a test case being called and prints out an appropriate test result message, based on the result of the test. 4. Add any additional test cases that you think are appropriate. 6. Finally, orchestrate everything with a main menu loop that asks the user what they would like to do. 1. Determine the input file name to use: 1. Provide an option that will read the file: data_v1.csv 2. Provide an option for the user to type in the filename to be read. You might find this useful in your own testing. 2. Determine the user's desired processing: 1. Allows the user to select any report, any test case, or Quit. 2. Provide an "All" option that runs all the reports and all test cases. 3. Allow the user to read data from a different file (see 6.a.ii above). 4. Be sure to print out all the available menu options at least once. {{{{{{{{{{1,!!! [1111 1111 111 nilsillo 3. Create the following 3 data reports: A. An "Employee Phone Number List" Report that lists: ID, LastName, FirstName, and PhoneNumber. Sorting is optional. B. An "Input Data Quality Report" that lists all the data, in the order it was input. It follows the input data with 3 error sections that describe the data quality problems that may have occurred. You might want to do this report after everything else is working. 1. While listing the data that was read, print a single line with a single "*" (asterisk) to indicate when there was a problem with a row of input data. You can include a description of the problem after the asterisk. 2. At the end of the "Input Data Quality Report", provide 3 "Data Quality Exceptions Sections": 1. A list of any "Duplicates" (duplicates should be ignored as data). 1. Records are considered duplicates if the ID is duplicated. 2. List each duplicated original input line in this section. 3. Summarize this section with the "Total Count of Duplicate Records". 2. A list of any "Incomplete Records" incomplete (these should be ignored as data). 1. Records are considered incomplete if any field is missing a value. 2. Print each incomplete record by printing the original input line in this section. 3. Summarize this section with the "Total Count of Incomplete Records". 3. Finally, in an " Exceptions Section Summary", list the "Total Error Count" (the sum of 1 and 2 above), and "Total Good Records Count". 3. This "Input Data" report can be requested at any time by the user. (See #6 below.) 4. Be sure to include a data header row in the appropriate places in this multi-part report. C. For the 3rd report, design your own report that takes advantage of your object-oriented design. D. REPORT NOTES: 1. All reports should have: 1. A Title, 2. A header row (column names), 3. Followed by all the report data. 4. At the end of every report, you should print a message indicating how many "Total Rows" were in the report. Do not count the header in this count 3. You should consider creating a method called InfoToString to create the output strings that will be printed in each report. 1. Use this method to create the strings (lines) that you will print out in all the reports. 2. See if you can also use some form of this method to create the "Column Header" line for each report. 3. Then each PrintReport method just prints out all these strings, each on a separate line, followed by the report line total count. 4. Ideally, the columns of each report will line up vertically. 1. You might choose to get this "columnization" to work after you have everything else working, unless not having things in columns makes your code debugging too difficult. (A hint on how to do this is in the readCVS.cpp example file.] 5. The Employee ID is expected to be unique. You will enforce this by ignoring rows with duplicate IDs. Employee names and locations may not be unique 6. IMPORTANT: CLion has a default 120 character limit on output. See the "Removing CLion's 120 character output limit" section below on how you can remove that limit so your reports will display properly. 4. Create the following 3 analytical reports: 1. An "Employee Cluster Report" shows the number of employees living in each ZipCode. The report lists the Zip Code, City, State, and EmployeeCount. 1. List each ZipCode only once. 2. Sorting by ZipCode is optional. 3. This report might be used to help decide where to build the next company office building. 2. An "Employee Pay Raise Report" shows: EmployeeName, Salary, NewSalary, and RaiseAmount, where each employee gets a 2.5% raise. 1. Write a Calculate EmployeeRaise method that takes one double argument, the percentRaise. Use it to give each employee a raise. 2. Note that NewSalary is a data element not in the original data file. 3. Sorting the report by the RaiseAmount is optional. 4. Be sure to include the employee's full name in the report. 3. An "Employee Regional Raises Report", showing the total of the raises by ZipCode. Sorting is optional. 5. Create 2 Unit Tests in a simple Test Harness. 1. Test01: Test that you get the correct number of rows printed in one of your reports. Provide a small test dataset (in the code), create the objects that would be created if this data had been read in, and then check that the resulting total number of rows that would be printed is correct. Return an appropriate value to the test harness. 2. Test02: Test the analysis of one of your analytic reports by providing a small test dataset (in the code), build your objects from it, generate the report, and check the result of the analysis. The "Employee Cluster Report" or the "Employee Regional Raises Report" are good candidates for this test, as they each have a summary number you can check in your test. Return an appropriate value to the test harness. 3. TEST NOTES: 1. Creating good test cases involves both good coding design and good test data choices. 2. Ideally, these test cases should not read from files. They should have all their data in the code. But it's ok to implement your test cases that read from specific test data files. 3. It is the test harness that executes the tests. The test harness then takes the result from a test case being called and prints out an appropriate test result message, based on the result of the test. 4. Add any additional test cases that you think are appropriate. 6. Finally, orchestrate everything with a main menu loop that asks the user what they would like to do. 1. Determine the input file name to use: 1. Provide an option that will read the file: data_v1.csv 2. Provide an option for the user to type in the filename to be read. You might find this useful in your own testing. 2. Determine the user's desired processing: 1. Allows the user to select any report, any test case, or Quit. 2. Provide an "All" option that runs all the reports and all test cases. 3. Allow the user to read data from a different file (see 6.a.ii above). 4. Be sure to print out all the available menu options at least once. {{{{{{{{{{1,!!! [1111 1111 111 nilsilloStep by Step Solution
There are 3 Steps involved in it
Step: 1

Get Instant Access to Expert-Tailored Solutions
See step-by-step solutions with expert insights and AI powered tools for academic success
Step: 2

Step: 3
Ace Your Homework with AI
Get the answers you need in no time with our AI-driven, step-by-step assistance
Get Started
Database Design Application Development And Administration
Authors: Michael V. Mannino
3rd Edition
0071107010, 978-0071107013