Answered step by step
Verified Expert Solution
Link Copied!

Question

1 Approved Answer

I need help trying to figure out how to use Engineering Equation Solver (EES). Could someone give an example about how to go about setting

I need help trying to figure out how to use Engineering Equation Solver (EES). Could someone give an example about how to go about setting up this problem and making a parametric table and plot?
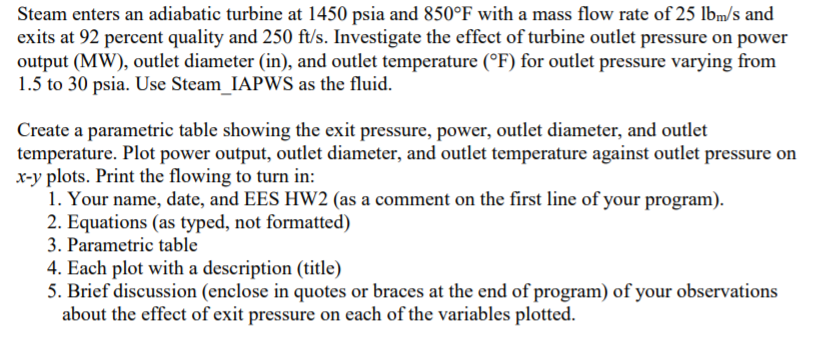
image text in transcribed

Steam enters an adiabatic turbine at 1450 psia and 850F with a mass flow rate of 25 lbm/s and exits at 92 percent quality and 250 ft/s. Investigate the effect of turbine outlet pressure on power output (MW), outlet diameter (in), and outlet temperature (F) for outlet pressure varying from 1.5 to 30 psia. Use Steam_IAPWS as the fluid. Create a parametric table showing the exit pressure, power, outlet diameter, and outlet temperature. Plot power output, outlet diameter, and outlet temperature against outlet pressure on x-y plots. Print the flowing to turn in: 1. Your name, date, and EES HW2 (as a comment on the first line of your program). 2. Equations (as typed, not formatted) . Parametric table 4. Each plot with a description (title) 5. Brief discussion (enclose in quotes or braces at the end of program) of your observations about the effect of exit pressure on each of the variables plotted. Steam enters an adiabatic turbine at 1450 psia and 850F with a mass flow rate of 25 lbm/s and exits at 92 percent quality and 250 ft/s. Investigate the effect of turbine outlet pressure on power output (MW), outlet diameter (in), and outlet temperature (F) for outlet pressure varying from 1.5 to 30 psia. Use Steam_IAPWS as the fluid. Create a parametric table showing the exit pressure, power, outlet diameter, and outlet temperature. Plot power output, outlet diameter, and outlet temperature against outlet pressure on x-y plots. Print the flowing to turn in: 1. Your name, date, and EES HW2 (as a comment on the first line of your program). 2. Equations (as typed, not formatted) . Parametric table 4. Each plot with a description (title) 5. Brief discussion (enclose in quotes or braces at the end of program) of your observations about the effect of exit pressure on each of the variables plotted

Step by Step Solution

There are 3 Steps involved in it

Step: 1

blur-text-image

Get Instant Access to Expert-Tailored Solutions

See step-by-step solutions with expert insights and AI powered tools for academic success

Step: 2

blur-text-image

Step: 3

blur-text-image

Ace Your Homework with AI

Get the answers you need in no time with our AI-driven, step-by-step assistance

Get Started

Recommended Textbook for

Machine Learning And Knowledge Discovery In Databases European Conference Ecml Pkdd 2022 Grenoble France September 19 23 2022 Proceedings Part 4 Lnai 13716

Authors: Massih-Reza Amini ,Stephane Canu ,Asja Fischer ,Tias Guns ,Petra Kralj Novak ,Grigorios Tsoumakas

1st Edition

3031264118, 978-3031264115

More Books

Students also viewed these Databases questions

Question

Can U. S. companies listed on U. S. stock exchanges use IFRS?

Answered: 1 week ago