

Question
I need help with business statistics work using excel and the necessary fucntions. Please guide me as much as possible, By using this excel data
I need help with business statistics work using excel and the necessary fucntions. Please guide me as much as possible,
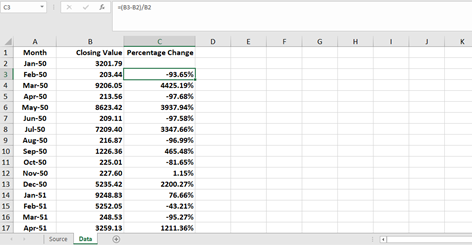
By using this excel data how can I Calculate summary measures (average, median, st. dev., min, max, 25th percentile, 75th percentile, and count) of the variable Percentage Change using Excel. For percentile, I was instructed to use an inclusive function.NOTE this is just an example of data I just need the functions of measures to start.
0 (83-B21/B2 D m E G H 1 Month 2 Jan-50 3 Feb-50 4 Mar-50 5 Apr-50 6 May-50 7 Jun-50 8 Jul-50 9 Aug-50 10 Sep-50 11 Oct-50 12 Nov-50 13 Dec-50 Jan-51 15 Feb-51 16 Mar-51 Apr-51 Source B Closing Value Percentage Change 3201.79 203.44 -93.65% 9206.05 4425.19% 213.56 -97.68% 8623.42 3937.94% 209.11 -97.58% 7209.40 3347.66% 216.87 -96.99% 1226.36 465.48% 225.01 227.60 1.15% 5235.42 2200.27% 9248.85 76.66% 5252.05 -43.21% 248.53 -95.27% 3259.15 1211.36% 14 17 0 (83-B21/B2 D m E G H 1 Month 2 Jan-50 3 Feb-50 4 Mar-50 5 Apr-50 6 May-50 7 Jun-50 8 Jul-50 9 Aug-50 10 Sep-50 11 Oct-50 12 Nov-50 13 Dec-50 Jan-51 15 Feb-51 16 Mar-51 Apr-51 Source B Closing Value Percentage Change 3201.79 203.44 -93.65% 9206.05 4425.19% 213.56 -97.68% 8623.42 3937.94% 209.11 -97.58% 7209.40 3347.66% 216.87 -96.99% 1226.36 465.48% 225.01 227.60 1.15% 5235.42 2200.27% 9248.85 76.66% 5252.05 -43.21% 248.53 -95.27% 3259.15 1211.36% 14 17Step by Step Solution
There are 3 Steps involved in it
Step: 1

Get Instant Access to Expert-Tailored Solutions
See step-by-step solutions with expert insights and AI powered tools for academic success
Step: 2

Step: 3
Ace Your Homework with AI
Get the answers you need in no time with our AI-driven, step-by-step assistance
Get Started
How To Make A Database In Historical Studies
Authors: Tiago Luis Gil
1st Edition
3030782409, 978-3030782405