Answered step by step
Verified Expert Solution
Question
1 Approved Answer
I need help with number 11 please. My answer is incorrect. Selected hypothetical financial data of Target and Wal-Mart for 2022 are presented here (in
I need help with number 11 please. My answer is incorrect.
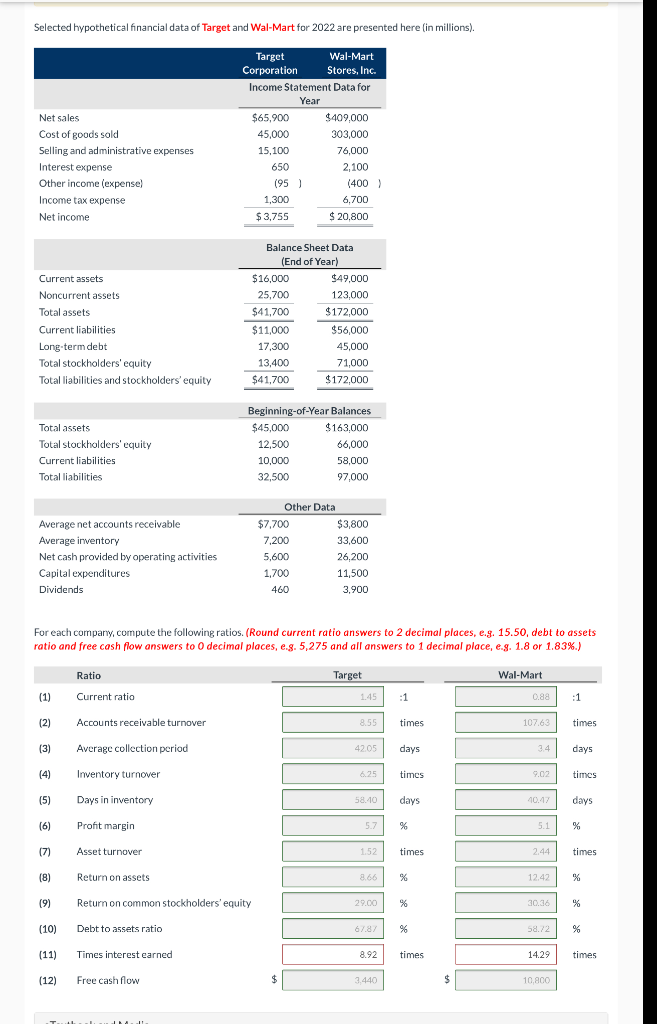
Selected hypothetical financial data of Target and Wal-Mart for 2022 are presented here (in millions). Net sales Cost of goods sold Selling and administrative expenses Interest expense Other income (expense) Income tax expense Net income Target Wal-Mart Corporation Stores, Inc. Income Statement Data for Year $65,900 $409,000 45,000 303,000 15,100 76,000 650 2,100 (95) (400) 1,300 6.700 $ 20,800 $ 3.755 Current assets Noncurrent assets Total assets Current liabilities Long-term debt Total stockholders' equity Total liabilities and stockholders' equity Balance Sheet Data (End of Year) $16,000 $49,000 25.700 123,000 $41,700 $172,000 $56,000 $ 17,300 45,000 13,400 71.000 $41,700 $172,000 $11,000 Total assets Total stockholders' equity Current liabilities Total liabilities Beginning-of-Year Balances $45,000 $163,000 12,500 66,000 10,000 58,000 32.500 97,000 Average net accounts receivable Average inventory Net cash provided by operating activities Capital expenditures Dividends Other Data $7,700 $3,800 7,200 33,600 5,600 26,200 1,700 11,500 460 3.900 For each company, compute the following ratios. (Round current ratio answers to 2 decimal places, e.g. 15.50, debt to assets ratio and free cash flow answers to O decimal places, e.g. 5,275 and all answers to 1 decimal place, e.g. 1.8 or 1.83%.) Ratio Target Wal-Mart (1) Current ratio 1.45 :1 0.88 :1 (2) Accounts receivable turnover 8.55 times 107.63 times (3) 42.05 days 3.4 days Average collection period Inventory turnover (4) 6.25 times 9.02 times (5) Days in inventory 58.40 days 10.17 days (6) Profit margin 5.7 % 5.1 % (7) Asset turnover 1.52 times 2.44 times (8) Return on assets % 12.42 (9) Return on common stockholders' equity 29.00 % 30.316 % (10) Debt to assets ratio 67.87 58.72 % (11) Times interest earned 8.92 times 14.29 times (12) Free cash flow $ 3,440 $ 10,800Step by Step Solution
There are 3 Steps involved in it
Step: 1

Get Instant Access to Expert-Tailored Solutions
See step-by-step solutions with expert insights and AI powered tools for academic success
Step: 2

Step: 3
Ace Your Homework with AI
Get the answers you need in no time with our AI-driven, step-by-step assistance
Get Started