Question
I need help with question 9 of this homework please and thank you!! I've posted the question and the previous one for reference. Language: python.
I need help with question 9 of this homework please and thank you!! I've posted the question and the previous one for reference. Language: python. Thank you!!


TO COPY:
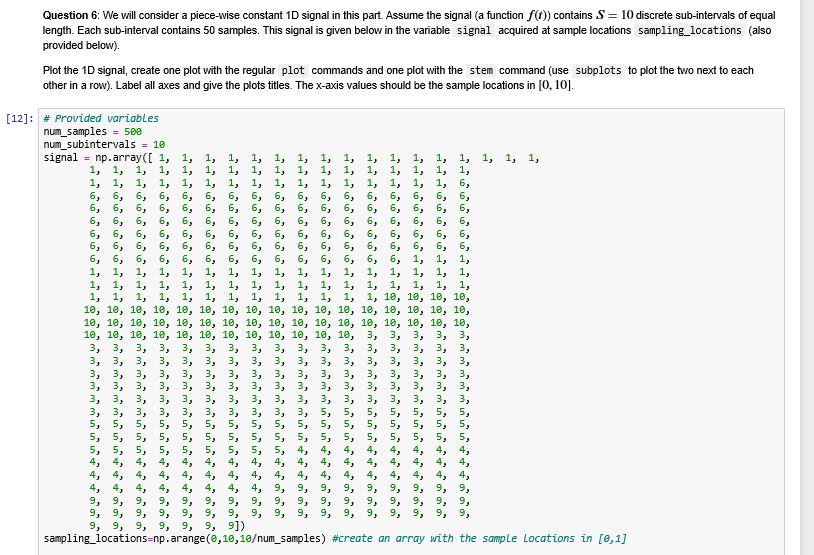
num_samples = 500 num_subintervals = 10 signal = np.array([ 1, 1, 1, 1, 1, 1, 1, 1, 1, 1, 1, 1, 1, 1, 1, 1, 1, 1, 1, 1, 1, 1, 1, 1, 1, 1, 1, 1, 1, 1, 1, 1, 1, 1, 1, 1, 1, 1, 1, 1, 1, 1, 1, 1, 1, 1, 1, 1, 1, 1, 6, 6, 6, 6, 6, 6, 6, 6, 6, 6, 6, 6, 6, 6, 6, 6, 6, 6, 6, 6, 6, 6, 6, 6, 6, 6, 6, 6, 6, 6, 6, 6, 6, 6, 6, 6, 6, 6, 6, 6, 6, 6, 6, 6, 6, 6, 6, 6, 6, 6, 6, 6, 6, 6, 6, 6, 6, 6, 6, 6, 6, 6, 6, 6, 6, 6, 6, 6, 6, 6, 6, 6, 6, 6, 6, 6, 6, 6, 6, 6, 6, 6, 6, 6, 6, 6, 6, 6, 6, 6, 6, 6, 6, 6, 6, 6, 6, 6, 6, 6, 1, 1, 1, 1, 1, 1, 1, 1, 1, 1, 1, 1, 1, 1, 1, 1, 1, 1, 1, 1, 1, 1, 1, 1, 1, 1, 1, 1, 1, 1, 1, 1, 1, 1, 1, 1, 1, 1, 1, 1, 1, 1, 1, 1, 1, 1, 1, 1, 1, 1, 10, 10, 10, 10, 10, 10, 10, 10, 10, 10, 10, 10, 10, 10, 10, 10, 10, 10, 10, 10, 10, 10, 10, 10, 10, 10, 10, 10, 10, 10, 10, 10, 10, 10, 10, 10, 10, 10, 10, 10, 10, 10, 10, 10, 10, 10, 10, 10, 10, 10, 3, 3, 3, 3, 3, 3, 3, 3, 3, 3, 3, 3, 3, 3, 3, 3, 3, 3, 3, 3, 3, 3, 3, 3, 3, 3, 3, 3, 3, 3, 3, 3, 3, 3, 3, 3, 3, 3, 3, 3, 3, 3, 3, 3, 3, 3, 3, 3, 3, 3, 3, 3, 3, 3, 3, 3, 3, 3, 3, 3, 3, 3, 3, 3, 3, 3, 3, 3, 3, 3, 3, 3, 3, 3, 3, 3, 3, 3, 3, 3, 3, 3, 3, 3, 3, 3, 3, 3, 3, 3, 3, 3, 3, 3, 3, 3, 3, 3, 3, 3, 5, 5, 5, 5, 5, 5, 5, 5, 5, 5, 5, 5, 5, 5, 5, 5, 5, 5, 5, 5, 5, 5, 5, 5, 5, 5, 5, 5, 5, 5, 5, 5, 5, 5, 5, 5, 5, 5, 5, 5, 5, 5, 5, 5, 5, 5, 5, 5, 5, 5, 4, 4, 4, 4, 4, 4, 4, 4, 4, 4, 4, 4, 4, 4, 4, 4, 4, 4, 4, 4, 4, 4, 4, 4, 4, 4, 4, 4, 4, 4, 4, 4, 4, 4, 4, 4, 4, 4, 4, 4, 4, 4, 4, 4, 4, 4, 4, 4, 4, 4, 9, 9, 9, 9, 9, 9, 9, 9, 9, 9, 9, 9, 9, 9, 9, 9, 9, 9, 9, 9, 9, 9, 9, 9, 9, 9, 9, 9, 9, 9, 9, 9, 9, 9, 9, 9, 9, 9, 9, 9, 9, 9, 9, 9, 9, 9, 9, 9, 9, 9]) sampling_locations=np.arange(0,10,10um_samples) #create an array with the sample locations in [0,1]
plt.subplot(1,2,1) plt.plot(sampling_locations,signal) plt.xlabel('Sampling Locations') plt.ylabel('Signal') plt.title('Using Plot')
plt.subplot(1,2,2) plt.stem(sampling_locations,signal) plt.xlabel('Sampling Locations') plt.ylabel('Signal') plt.title('Using Stem') plt.tight_layout() plt.show()
The 'sampling locations' list divided into sub intervals, and the average noise within that sub interval calculated. For example, if you want 10 sub intervals in a 500 sample, you would use numbers from the 0-50 interval and average the numbers in that range.
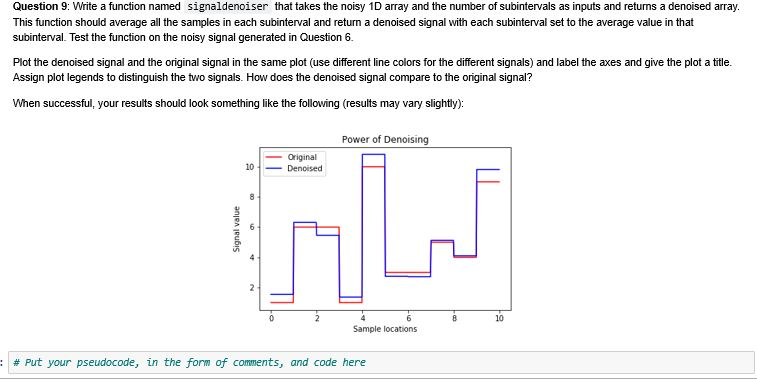
One of the TAs mentioned averaging over the noisy signal as there is a typo in the question. THANK YOU
Question 9: Write a function named signaldenoiser that takes the noisy 1D array and the number of subintervals as inputs and returns a denoised array. This function should average all the samples in each subinterval and return a denoised signal with each subinterval set to the average value in that subinterval. Test the function on the noisy signal generated in Question 6. Plot the denoised signal and the original signal in the same plot (use different line colors for the different signals) and label the axes and give the plot a title. Assign plot legends to distinguish the two signals. How does the denoised signal compare to the original signal? When successful, your results should look something like the following (results may vary slightly): Power of Denoising Original 10 Denoised Signal value Sample locations # Put your pseudocode, in the form of comments, and code here Question 6: We will consider a piece-wise constant 1D signal in this part. Assume the signal (a function f(f)) contains S= 10 discrete sub-intervals of equal length. Each sub-interval contains 50 samples. This signal is given below in the variable signal acquired at sample locations sampling_locations (also provided below). Plot the 1D signal, create one plot with the regular plot commands and one plot with the stem command (use subplots to plot the two next to each other in a row). Label all axes and give the plots titles. The x-axis values should be the sample locations in [0, 10]. [12]: 1, 1, 1, 1, 1, # Provided variables num_5amples = 588 num_subintervals = 18 signal = np.array([ 1, 1, 1, 1, 1, 1, 1, 1, 1, 1, 1, 1, 5, 6, 6, 6, 6, 5, 6, 6, 1, 1, 1, 1, 1, d = gss FI'I't ' +--'''- --- === ===e'l' --- --- +++III't +7+7+ IIIIII - *'*'t'l'l'l'l' +-- '' --- === +-- IIIIII --' - ' m '' m m +P +W Itho I' + + +pppmmmmmm I I IN f' ' 'C' ===I' ---''''' ' ' m m'm'm'm'm'm'I' I'l'+ - ===''''''''''''I'+++ '''''' m'm'm'm'm It'++ 'm'm'm'm'm't' I' IF ' '''''''e' t 'm'm'm'm'm'm'I' I' ++ 'm'm'm'm'm'I' I'I ' + +''' -pm'm'm' 'I' I' F mmmmmm th+++'' ''''''''' 'm'm'm'm'm' t'R' I' m'm'm'm'm' I' I' I' ' ' ' ''m' +++ 'm'm' ' - ' 4, 4, 4, 4, 4, 4, 4, 4, 4, 4, 4, 4, 4, 4, 4, 4, 4, 4, 4, 4, 4, 4, 4, 4, 4, 9, 9, 9, 9, 9, 9, 9, 9, 9, 9, 9, 9, 9, 9, 9, 9, 9, 9, 9, 9, 9, 9, 9, 9, 9, 9, 9, 9, 9, 9, 9, 9, 9, 9, 9, 9, 9, 9, 9, 9, 9, 9, 9, 9, 9, 9, 9, 9]) Sampling_locations=np. arange(8,10,18um_samples) #create an array with the sample Locations in [8,1] 13]: # Put your pseudocode, in the form of comments, and code here plt.subplot(1,2,1) plt.plot(sampling_locations, signal) plt.xlabel('Sampling Locations) plt.ylabel('Signal') plt.title('Using Plot) plt. subplot(1,2,2) plt.stem (sampling_locations, signal) plt.xlabel('Sampling Locations) plt.ylabel('Signal') plt.title('Using Stem') plt.tight_layout() plt.show()Step by Step Solution
There are 3 Steps involved in it
Step: 1

Get Instant Access to Expert-Tailored Solutions
See step-by-step solutions with expert insights and AI powered tools for academic success
Step: 2

Step: 3

Ace Your Homework with AI
Get the answers you need in no time with our AI-driven, step-by-step assistance
Get Started


