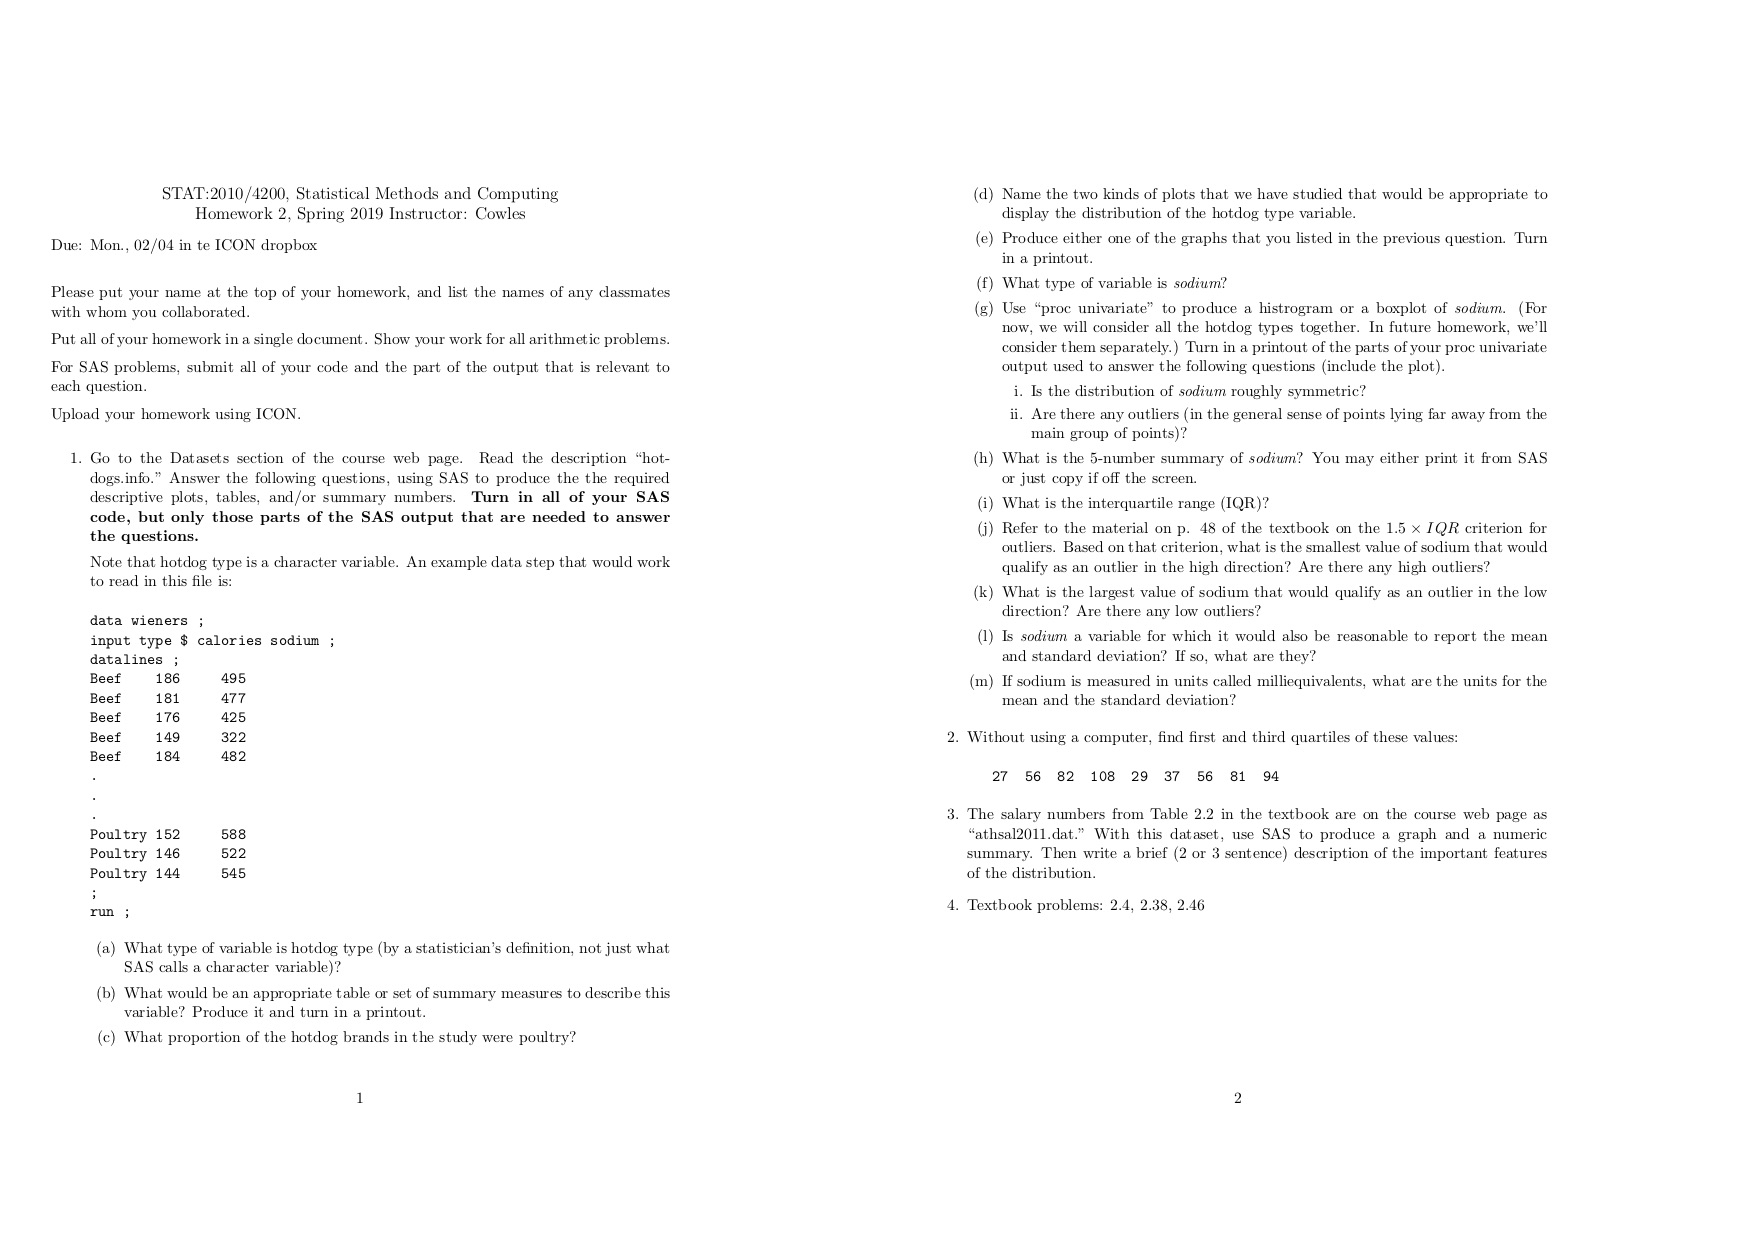
I need help with questions 1 and 3. please and thank you.
STAT : 2010/ 1200. Statistical Methods and Computing ( d) Name the two kinds of plots that we have studied that would be appropriate to Homework 2 . Spring 2019 Instructor : Cowles* display the distribution of the hotdog type variable .\\ Due : Mon . , 12 / 04 in te ICON dropbox* ( e ) Produce either one of the graphs that you listed in the previous question . Turn* in a printout ." Please put your name at the top of your homework , and list the names of any classmates* ( F) What type of variable is sodium ?" with whom you collaborated .\\ ( 6 ) Use " proc univariate " to produce a histogram or a boxplot of sodium . ( For Put all of your homework in a single document . Show your work for all arithmetic problems . now , we will consider all the hotdog types together . In future homework , we'll* consider them separately . ) Turn in a printout of the parts of your proc univariate* For SAS problems , submit all of your code and the part of the output. that is relevant to output used to answer the following questions ! ] wide the plot. ) ." each question .* 1 . Is the distribution of sodium roughly symmetric ?\\ Upload your homework using ICON .* ii . Are there any outliers ( in the general sense of points lying far away from the main group of points ) ?\\ 1 . Go to the Datasets section of the course web page . Read the description " hot - ( h ) What is the 5 - number summary of sodium ?" You may either print it from SAS` dogs info . " Answer the following questions , using SAS to produce the the required. or just copy if off the screen .* descriptive plots , tables , and / or summary numbers . Turn in all of your SAS code , but only those parts of the SAS output that are needed to answer ( 1 ) What is the interquartile range ( TOR ) ?` the questions .* ( i ) Refer to the material on p . 18 of the textbook on the 1.5 x 1QR criterion for* Note that hotdog type is a character variable . An example data step that would work* outliers . Based on that criterion , what is the smallest value of sodium that would to read in this file is :` qualify as an outlier in the high direction ?" Are there any high outliers ?"\\ ( K ) What is the largest value of sodium that would qualify as an outlier in the low data wieners ;\\ direction ?' Are there any low outliers ?'` input type $ calories sodium ; ( 1 ) Is sodium a variable for which it would also be reasonable to report the meall datalines ; and standard deviation ?' If so , what are they ?` Beef 186 495 Beef 181 477 ( In ) If sodium is measured in units called milliequivalents , what are the units for the 176 mean and the standard deviation ?"* Beef 425 Beef 149 322 2 . Without using a computer , find first and third quartiles of these values :" Beef 184 480 27 56 82 108 29 37 56 81 94 3 . The salary numbers from Table 2.2 in the textbook are on the course web page as Poultry 152 58 8 522 "athsal2011 . dat . " With this dataset , use SAS to produce a graph and a numeric Poultry 146 summary . Then write a brief ( 2 or 3 sentence ) description of the important features* Poultry 144 545 of the distribution .* run ; 1 . Textbook problems : 2.1 , 2.38 , 2.16\\ ( a ) What type of variable is hotdog type ( by a statistician's definition , not just what* SAS calls a character variable ) ?\\ ( b ) What would be an appropriate table or set of summary measures to describe this variable ? Produce it and turn in a printout.` ( C) What proportion of the hotdog brands in the study were poultry ?" 2


