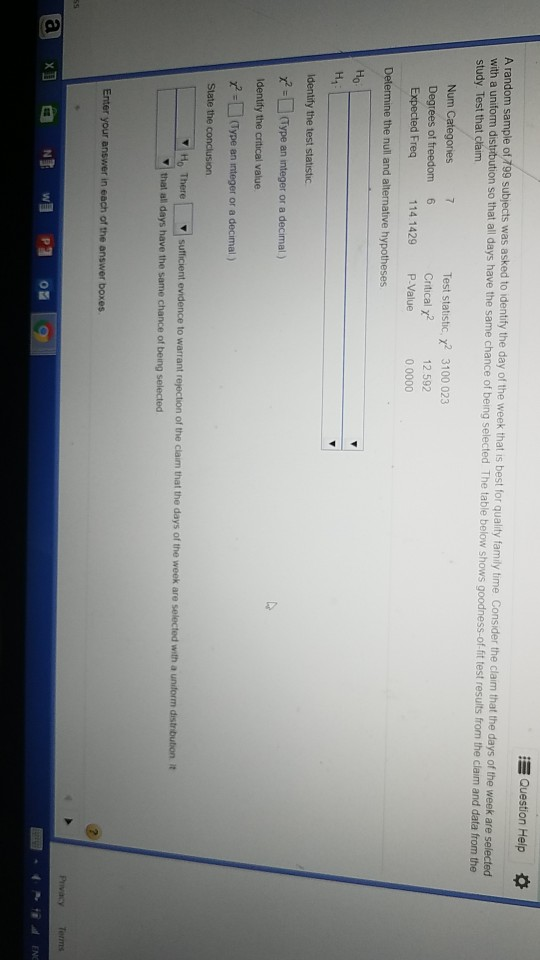
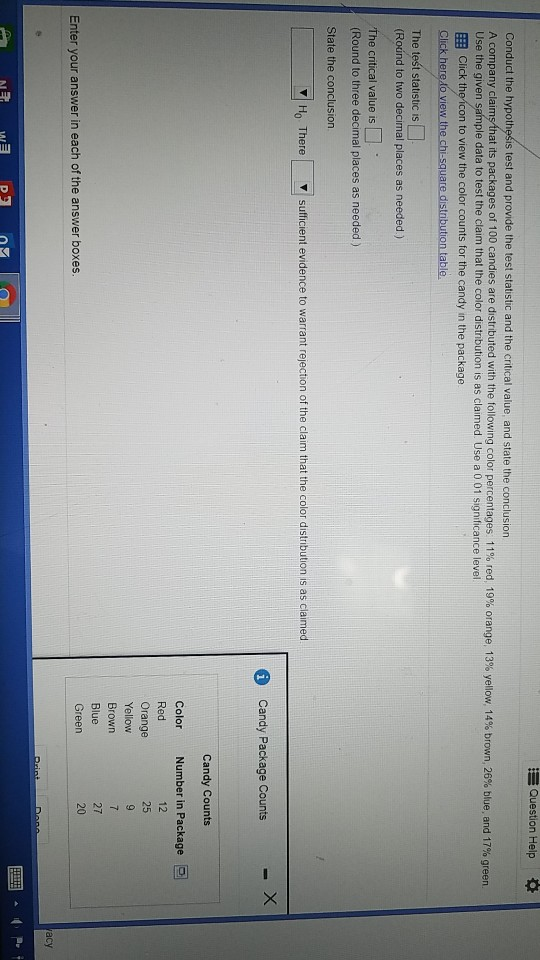
I need help with questions
see picture attached in below
Thanks
I study. Test that claim Expected Freq Num Categories State the conclusion Identify the test statistic Degrees of freedom Identify the critical value N x2 =(Type an integer or a decimal ) x2 =(Type an integer or a decimal ) Determine the null and alternative hypotheses W Enter your answer in each of the answer boxes 114.1429 that all days have the same chance of being selected P-Value Critical y? Test statistic, x x2 3100 023 12.592 0000 0 with a uniform distubution so that all days have the same chance of being selected The table below shows goodness-of-fit test results from the claim and data from the A random sample of 799 subjects was asked to identify the day of the week that is best for quality family time. Consider the claim that the days of the week are selected sufficient evidence to warrant rejection of the claim that the days of the week are selected with a undorm distribution. it Question Help ENClick the-ic "The critical value is State the conclusion. The test statistic is Ho There (Round to two decimal places as needed.) (Round to three decimal places as needed Enter your answer in each of the answer boxes. Click heredo view the chi-square distribution table. icon to view the color counts for the candy in the package. Conduct the hypothesis test and provide the test statistic and the critical value, and state the conclusion Use the given sample data to test the claim that the color distribution is as claimed. Use a 0 01 significance level. sufficient evidence to warrant rejection of the claim that the color distribution is as claimed. A company claims that its packages of 100 candies are distributed with the following color percentages: 1 1% red, 19% orange, 13% yellow, 14% brown, 26% blue, and 17% green. Red Blue Color Yellow Brown Green Orange Candy Package Counts Candy Counts Number in Package Question Help X acy