I need help with some formula in this excel.


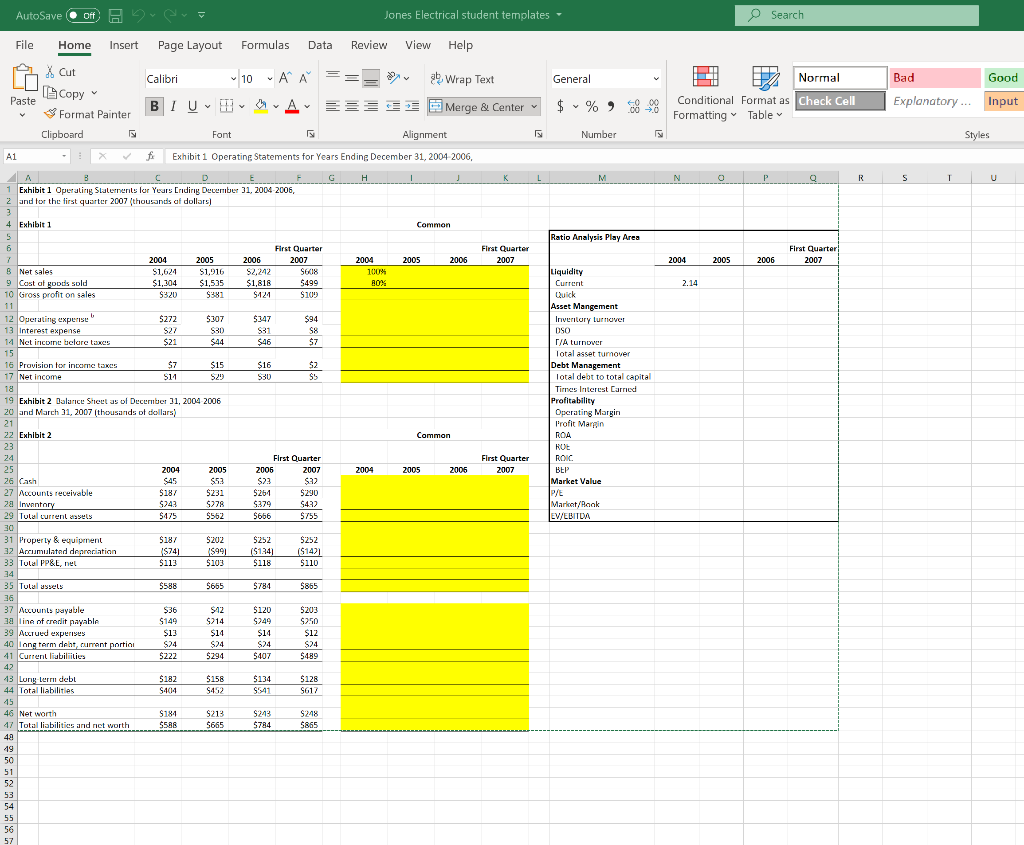
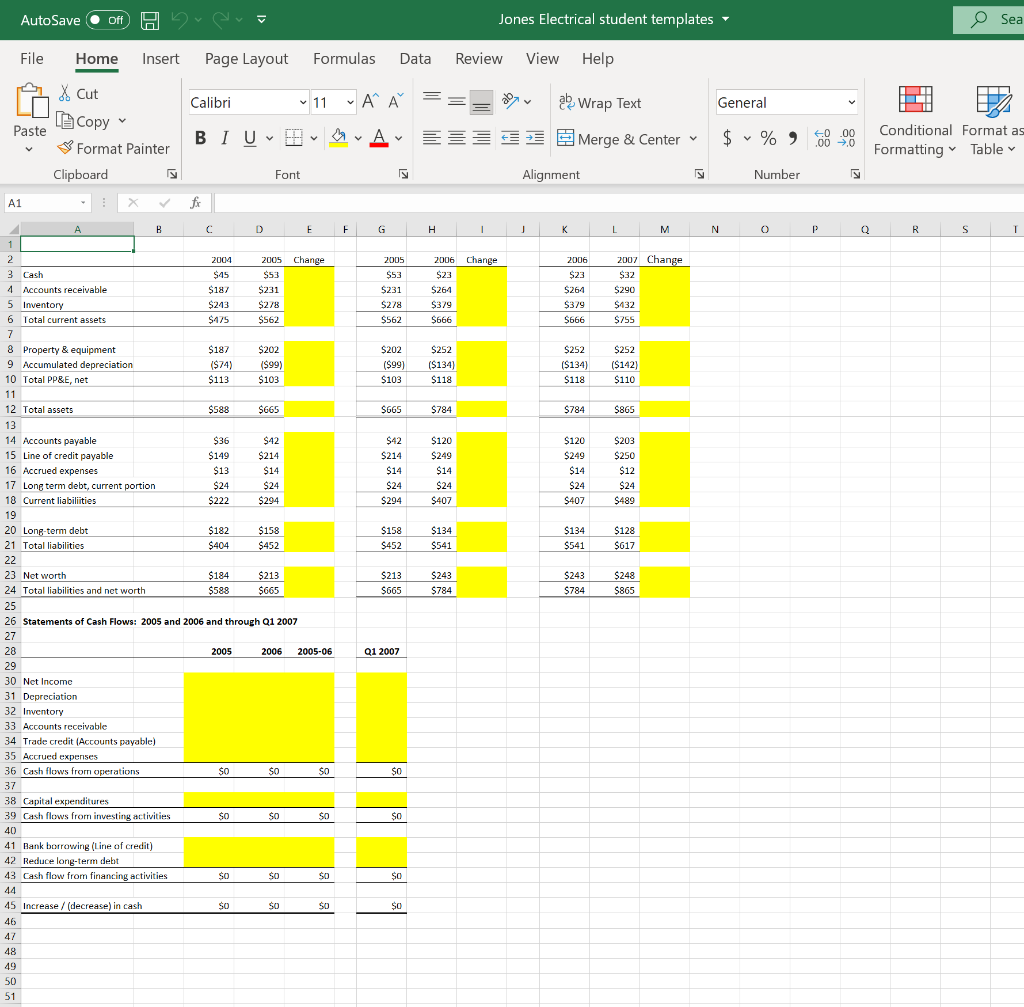
AutoSave oft Jones Electrical student templates O Search = General D Normal Bad Good y $ %) 08-0 Conditional Format as Check Cell Formatting Table Explanatory... Input File Home Insert Page Layout Formulas Data Review View Help X * Cut Calibri 10 AA Wrap Text Copy Paste BIU- WA Format Painter Merge & Center Clipboard Font Alignment A1 X f Exhibit 1 Operating Statements for Years Ending December 31, 2004 2006, A B _____________ H 1 Exhibit 1 Operating Statements for Years Erding December 31, 2004-2006, 2 and for the first quarter 2007 (thousands of dollars) Number Styles M N Q R S 1 U Common Ratio Analysis Play Area First Quarter 2007 First Quarter! 2007 2005 2006 2004 2005 2006 2006 $2,242 $1,818 S124 First Quarter 2007 5608 $499 $100 2004 100% BOX 2.14 $30 $347 S31 $46 $94 S8 $7 $16 530 $2 SS Liquidity Current Quick Asset Mangement Inventory turnover DSO T/A turnover Total asset turnover Debt Management Total debt to total capital Times Interest Carried Profitability Operating Margin Profit Margin ROA ROL ROIC Market Value P/E Market/Rook EV/EBITDA Common First Quarter 2007 2004 2005 2005 First Quarter 2006 2007 s2a $22 $261 5290 5379 $ $432 5656 5755 4 Exhibit 1 1 5 6 7 2004 2005 8 Net sales $1,624 $1,916 9 Cost of goods sold $1,304 $1,535 10 Gross profit on sales $320 9381 11 12 Ouerating expense 0 $272 $307 13 Interest expense S27 14 Not incoin bctarc taxes $21 $44 15 16 Provision for income taxes $7 $15 17 Net income $11 $29 18 19 Exhibit 2 Balance Sicut as of December 31, 2004 2006 20 and March 31, 2007 (thousands of dollars) 21 22 Exhibit 2 23 24 25 2004 2005 26 Cash $45 $53 27 Accounts receivable 5187 5231 28 Inventory 5243 $278 29 Tulal current sus $475 5562 30 31 Property & equipment $187 $202 32 Accumulated denrariation 1$74 ($991 33 Tulal PP&L, ne $113 $103 34 35 Tulal assets $588 565 36 37 Alcuunts payable $36 $12 na line of credit payable $149 9214 39 Alcrued experises $13 $14 40 long term deht, current portini $24 $24 41 Current liabilities $222 $294 42 43 Lung lerri debl $182 $158 44 Total liabilities 5404 9412 45 46 Net worth $184 9213 47 Total liabilities and net worth $588 $665 48 49 50 51 52 53 54 55 56 57 5252 ($1241 5118 $252 ($1421 5110 5784 5855 $120 $249 $14 $24 $407 5203 $2.50 $12 $24 $489 $134 S441 $128 S617 9243 $784 9218 $865 AutoSave Off over Avevo Jones Electrical student templates O Sea File Home Insert Page Layout Formulas Data Review View Help Calibri 11 AA 2 Wrap Text General Paste X Cut [Copy Format Painter Clipboard BIU - DA Merge & Center $ % 60 00 .00 0 Conditional Format as Formatting Table V Font Alignment Number A1 X fr A B C D E F G H 1 j L M N 0 P Q R S T 1 2005 Change 2006 $53 $231 $278 $562 2006 $23 $264 $379 $666 $23 $264 $379 $666 2007 Change $32 $290 $432 $755 $202 ($99) $103 $252 ($134) $118 $252 ($134) $118 $252 ($142) $110 $665 $784 $784 $865 $42 $214 $14 $24 $294 $120 $249 $14 $24 $407 $120 $249 $14 $24 $407 $203 $250 $12 $24 $489 $158 $452 $134 $541 $134 $541 $128 $617 2 2004 2005 Change 3 Cash $45 $53 4 Accounts receivable $187 $231 5 Inventory $243 $278 6 Total current assets $475 $562 7 8 Property & equipment $187 $202 9 Accumulated depreciation ($74) ($99) 10 Total PP&E, net $113 $103 11 12 Total assets $588 $665 13 14 Accounts payable $36 $42 15 Line of credit payable $149 $214 16 Accrued expenses $13 $14 17 Long term debt, current portion $24 $24 18 Current liabiliities $222 $294 19 20 Long-term debt $182 $158 21 Total liabilities $404 $452 22 23 Net worth $184 $213 24 Total liabilities and net worth $588 $665 25 26 Statements of Cash Flows: 2005 and 2006 and through Q1 2007 27 28 2005 2006 2005-06 29 30 Net Income 31 Depreciation 32 Inventory 33 Accounts receivable 34 Trade credit (Accounts payable) 35 Accrued expenses 36 Cash flows from operations $0 $0 SO 37 38 Capital expenditures 39 Cash flows from investing activities SO $ SO SO 40 41 Hank borrowing (line of credit) 42 Reduce long-term debt 43 Cash flow from financing activities $0 $0 $ 44 45 Increase / (decrease) in cash $0 0 $0 $0 46 $213 $665 $243 $784 $243 $784 $248 $865 Q1 2007 So $0 $0 0 $0 47 48 49 50 51 AutoSave oft Jones Electrical student templates O Search = General D Normal Bad Good y $ %) 08-0 Conditional Format as Check Cell Formatting Table Explanatory... Input File Home Insert Page Layout Formulas Data Review View Help X * Cut Calibri 10 AA Wrap Text Copy Paste BIU- WA Format Painter Merge & Center Clipboard Font Alignment A1 X f Exhibit 1 Operating Statements for Years Ending December 31, 2004 2006, A B _____________ H 1 Exhibit 1 Operating Statements for Years Erding December 31, 2004-2006, 2 and for the first quarter 2007 (thousands of dollars) Number Styles M N Q R S 1 U Common Ratio Analysis Play Area First Quarter 2007 First Quarter! 2007 2005 2006 2004 2005 2006 2006 $2,242 $1,818 S124 First Quarter 2007 5608 $499 $100 2004 100% BOX 2.14 $30 $347 S31 $46 $94 S8 $7 $16 530 $2 SS Liquidity Current Quick Asset Mangement Inventory turnover DSO T/A turnover Total asset turnover Debt Management Total debt to total capital Times Interest Carried Profitability Operating Margin Profit Margin ROA ROL ROIC Market Value P/E Market/Rook EV/EBITDA Common First Quarter 2007 2004 2005 2005 First Quarter 2006 2007 s2a $22 $261 5290 5379 $ $432 5656 5755 4 Exhibit 1 1 5 6 7 2004 2005 8 Net sales $1,624 $1,916 9 Cost of goods sold $1,304 $1,535 10 Gross profit on sales $320 9381 11 12 Ouerating expense 0 $272 $307 13 Interest expense S27 14 Not incoin bctarc taxes $21 $44 15 16 Provision for income taxes $7 $15 17 Net income $11 $29 18 19 Exhibit 2 Balance Sicut as of December 31, 2004 2006 20 and March 31, 2007 (thousands of dollars) 21 22 Exhibit 2 23 24 25 2004 2005 26 Cash $45 $53 27 Accounts receivable 5187 5231 28 Inventory 5243 $278 29 Tulal current sus $475 5562 30 31 Property & equipment $187 $202 32 Accumulated denrariation 1$74 ($991 33 Tulal PP&L, ne $113 $103 34 35 Tulal assets $588 565 36 37 Alcuunts payable $36 $12 na line of credit payable $149 9214 39 Alcrued experises $13 $14 40 long term deht, current portini $24 $24 41 Current liabilities $222 $294 42 43 Lung lerri debl $182 $158 44 Total liabilities 5404 9412 45 46 Net worth $184 9213 47 Total liabilities and net worth $588 $665 48 49 50 51 52 53 54 55 56 57 5252 ($1241 5118 $252 ($1421 5110 5784 5855 $120 $249 $14 $24 $407 5203 $2.50 $12 $24 $489 $134 S441 $128 S617 9243 $784 9218 $865 AutoSave Off over Avevo Jones Electrical student templates O Sea File Home Insert Page Layout Formulas Data Review View Help Calibri 11 AA 2 Wrap Text General Paste X Cut [Copy Format Painter Clipboard BIU - DA Merge & Center $ % 60 00 .00 0 Conditional Format as Formatting Table V Font Alignment Number A1 X fr A B C D E F G H 1 j L M N 0 P Q R S T 1 2005 Change 2006 $53 $231 $278 $562 2006 $23 $264 $379 $666 $23 $264 $379 $666 2007 Change $32 $290 $432 $755 $202 ($99) $103 $252 ($134) $118 $252 ($134) $118 $252 ($142) $110 $665 $784 $784 $865 $42 $214 $14 $24 $294 $120 $249 $14 $24 $407 $120 $249 $14 $24 $407 $203 $250 $12 $24 $489 $158 $452 $134 $541 $134 $541 $128 $617 2 2004 2005 Change 3 Cash $45 $53 4 Accounts receivable $187 $231 5 Inventory $243 $278 6 Total current assets $475 $562 7 8 Property & equipment $187 $202 9 Accumulated depreciation ($74) ($99) 10 Total PP&E, net $113 $103 11 12 Total assets $588 $665 13 14 Accounts payable $36 $42 15 Line of credit payable $149 $214 16 Accrued expenses $13 $14 17 Long term debt, current portion $24 $24 18 Current liabiliities $222 $294 19 20 Long-term debt $182 $158 21 Total liabilities $404 $452 22 23 Net worth $184 $213 24 Total liabilities and net worth $588 $665 25 26 Statements of Cash Flows: 2005 and 2006 and through Q1 2007 27 28 2005 2006 2005-06 29 30 Net Income 31 Depreciation 32 Inventory 33 Accounts receivable 34 Trade credit (Accounts payable) 35 Accrued expenses 36 Cash flows from operations $0 $0 SO 37 38 Capital expenditures 39 Cash flows from investing activities SO $ SO SO 40 41 Hank borrowing (line of credit) 42 Reduce long-term debt 43 Cash flow from financing activities $0 $0 $ 44 45 Increase / (decrease) in cash $0 0 $0 $0 46 $213 $665 $243 $784 $243 $784 $248 $865 Q1 2007 So $0 $0 0 $0 47 48 49 50 51


