Answered step by step
Verified Expert Solution
Question
1 Approved Answer
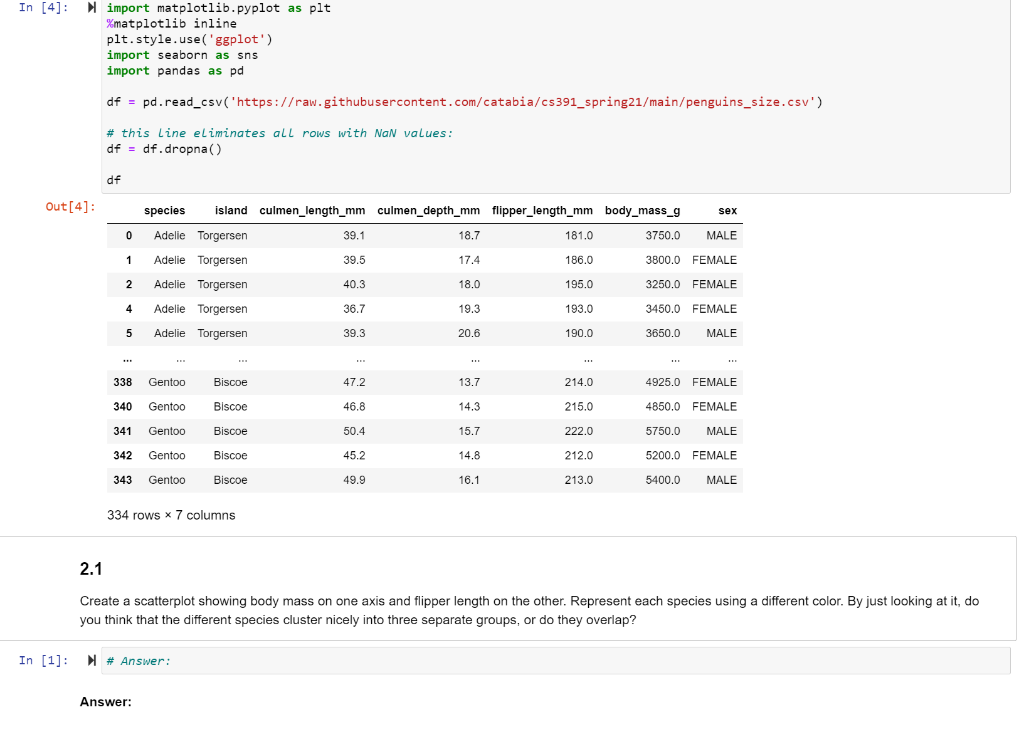
I need help with the following dataset from above. Create a function to do the below: Use the GMM method from scikit learn to categorize

I need help with the following dataset from above. Create a function to do the below:
Use the GMM method from scikit learn to categorize the data based on only the following four features: culmen length, culmen depth, flipper length, body mass.
In [4]: Nimport matplotlib.pyplot as plt %matplotlib inline plt.style.use('ggplot') import seaborn as sns import pandas as pd df = pd.read_csv('https://raw.githubusercontent.com/catabia/cs391_spring21/main/penguins_size.csv') # this Line eliminates all rows with NaN values: df = df.dropna () df Out[4]: 0 1 species island culmen_length_mm culmen_depth_mm flipper_length_mm body_mass_g sex Adelie Torgersen 39.1 18.7 181.0 3750.0 MALE Adelie Torgersen 39.5 17.4 186.0 3800.0 FEMALE Adelie Torgersen 40.3 18.0 195.0 3250.0 FEMALE Adelle Torgersen 36.7 19.3 193.0 3450.0 FEMALE 2 4 5 5 Adelie Torgersen 39.3 20.6 190.0 3650.0 MALE HIE 338 Gentoo Biscoe 47.2 13.7 214.0 4925.0 FEMALE 340 Gentoo Biscoe 46.8 14.3 215.0 4850.0 FEMALE 341 Gentoo Biscoe 50.4 15.7 222.0 5750.0 MALE 342 Gentoo Biscoe 45.2 14.8 212.0 5200.0 FEMALE 343 Gentoo Biscoe 49.9 16.1 213.0 5400.0 MALE 334 rows x 7 columns 2.1 Create a scatterplot showing body mass on one axis and flipper length on the other. Represent each species using a different color. By just looking at it, do you think that the different species cluster nicely into three separate groups, or do they overlap? In [1]: # Answer: Answer: In [4]: Nimport matplotlib.pyplot as plt %matplotlib inline plt.style.use('ggplot') import seaborn as sns import pandas as pd df = pd.read_csv('https://raw.githubusercontent.com/catabia/cs391_spring21/main/penguins_size.csv') # this Line eliminates all rows with NaN values: df = df.dropna () df Out[4]: 0 1 species island culmen_length_mm culmen_depth_mm flipper_length_mm body_mass_g sex Adelie Torgersen 39.1 18.7 181.0 3750.0 MALE Adelie Torgersen 39.5 17.4 186.0 3800.0 FEMALE Adelie Torgersen 40.3 18.0 195.0 3250.0 FEMALE Adelle Torgersen 36.7 19.3 193.0 3450.0 FEMALE 2 4 5 5 Adelie Torgersen 39.3 20.6 190.0 3650.0 MALE HIE 338 Gentoo Biscoe 47.2 13.7 214.0 4925.0 FEMALE 340 Gentoo Biscoe 46.8 14.3 215.0 4850.0 FEMALE 341 Gentoo Biscoe 50.4 15.7 222.0 5750.0 MALE 342 Gentoo Biscoe 45.2 14.8 212.0 5200.0 FEMALE 343 Gentoo Biscoe 49.9 16.1 213.0 5400.0 MALE 334 rows x 7 columns 2.1 Create a scatterplot showing body mass on one axis and flipper length on the other. Represent each species using a different color. By just looking at it, do you think that the different species cluster nicely into three separate groups, or do they overlap? In [1]: #Step by Step Solution
There are 3 Steps involved in it
Step: 1

Get Instant Access to Expert-Tailored Solutions
See step-by-step solutions with expert insights and AI powered tools for academic success
Step: 2

Step: 3

Ace Your Homework with AI
Get the answers you need in no time with our AI-driven, step-by-step assistance
Get Started


