I need help with the ratios on the orange sheet. Please show work. All the info is listed on the annual report
Make sure to use the 2019 info and show work please
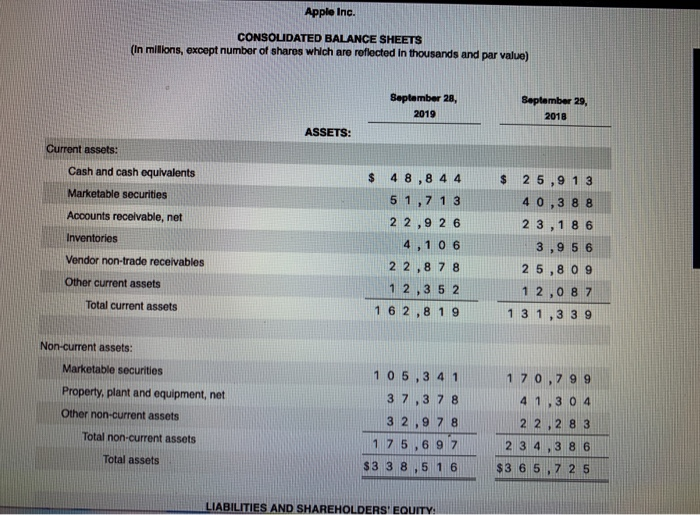
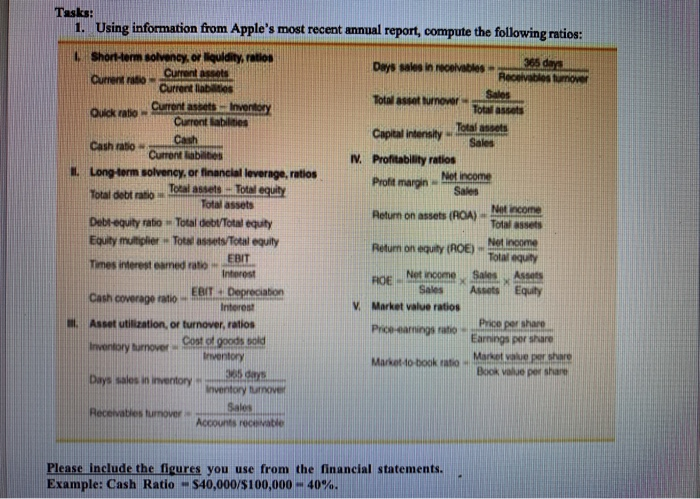
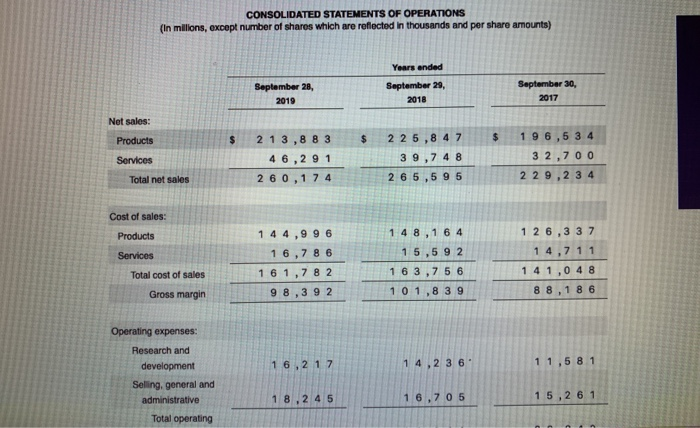
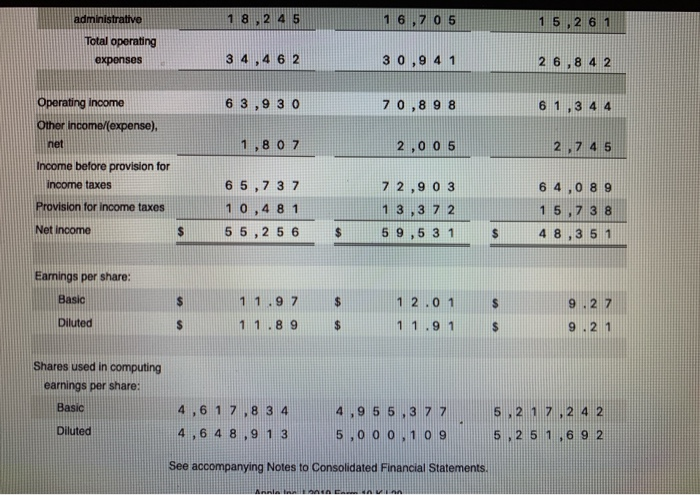
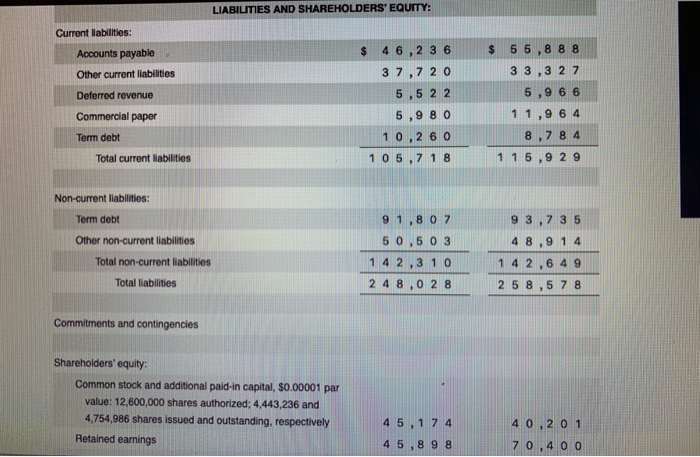
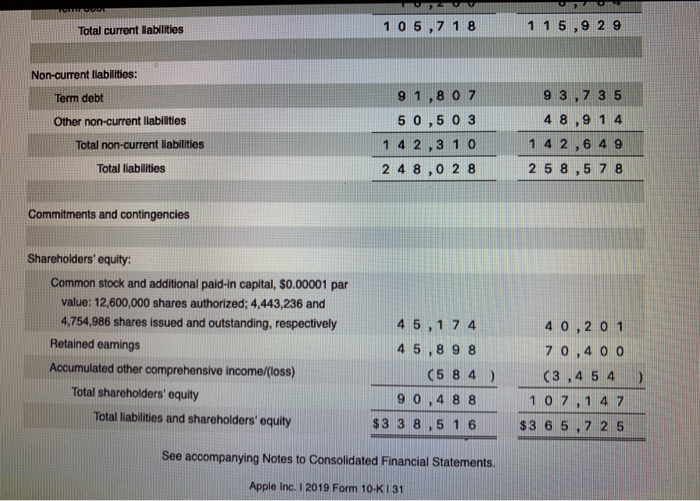
Current Current assets Cash ratio Curront ab To assets Noncom 1. Using information from Apple's most recent annual report compute the following ratios: Short-term solvency, or liquidity, ration Days sales in receivables - currentes Current assets Inve Total asset tumower Quick ratio cum Current abilities Capital intensity - Total Profitability ratios Long term solvency, or financial leverage ratios Profit margin-Net Income Total debt ratio Total assets - Total equity Sares Debt-equity ratio - Total debt Total equity Return on assets (ROA) Equity multiplier - Total assets/Toent equity Return on equity (ROE) Net income Times interest earned ratio ROE. Net soome Sales Cash coverage ratio EBITDepreciation Equity V Market value ratios Asset utilization, or turnover, ratios Price earnings ratio Inventory tumover. Cost of goods sold Market to book rate Market value per share Days sales in inventory Book value per share Inventory tumove Recevaties turnover - Accounts roce EBIT Assets Please include the figures you use from the financial statements. Example: Cash Ratio - S40,000/S100,000 - 40%. CONSOLIDATED STATEMENTS OF OPERATIONS (In milions, except number of shares which are reflected in thousands and per share amounts) Years ended September 28 September 30, September 29, 2018 Net sales: $ $ Products Services 2 1 3,8 8 3 46,291 260,174 225,8 4 7 39,7 48 2 6 5,5 95 196,5 3 4 32,700 229,2 3 4 Total net sales Cost of sales: Products 14 8,164 1 2 6,3 3 7 Services 15.5 9 2 . 7 1 1 1 4 4,996 16,786 161,78 2 98,392 Total cost of sales 1 6 3,7 5 6 1 41,0 48 88,1 8 6 Gross margin 101,8 39 14,2 36 5 8 1 Operating expenses: Research and development Seling, general and administrative Total operating 1 8 2 4 5 16,70 5 1 5,2 6 1 Total operating expenses 3 4,4 6 2 30,94 1 26,8 4 2 6 3,9 30 70,898 Operating income Other income/(expense) 1 80 7 2,00 5 2,7 4 5 Income before provision for income taxes Provision for income taxes Net income 6 5,7 37 10,4 81 55,2 5 6 7 2,903 1 3,3 7 2 59,5 31 6 4,0 89 15,7 38 Earnings per share: Basic Diluted 9 .2 7 11.97 11.89 12.01 11.91 $ $ 9.21 Shares used in computing earnings per share: Basic 4 4,6 1 7 , 8 34 4,6 48,9 1 3 ,95 5,3 7 7 5,00 0,1 09 5,2 172 4 2 ,2 5 1,6 9 2 Diluted 5 See accompanying Notes to Consolidated Financial Statements. Apple Inc. CONSOLIDATED BALANCE SHEETS (In milions, except number of shares which are reflected in thousands and par value) September 28, 2019 September 29, 2018 ASSETS: Current assets: Cash and cash equivalents Marketable securities Accounts receivable, net Inventories Vendor non-trade receivables Other current assets Total current assets $ 48,8 4 4 51,7 13 2 2,9 26 4,106 2 2,8 78 1 2,3 5 2 1 6 2,8 19 $ 25,9 13 40,388 2 3,1 86 3,956 25,8 09 1 2,087 1 3 1,3 39 Non-current assets: Marketable securities Property, plant and equipment, net Other non-current assets Total non-current assets Total assets 1 7 0,799 4 1.3 0 4 10 5,3 41 37,378 3 2 9 7 8 1 7 5 ,6 97 $3 3 8 ,5 1 6 2 3 4 ,3 8 6 $3 6 5,7 25 LIABILITIES AND SHAREHOLDERS' EQUITY: LIABILITIES AND SHAREHOLDERS' EQUITY: Current liabilities: Accounts payable Other current liabilities Deferred revenue $ 46,236 37,720 5,5 2 2 5,98 0 10,260 105,7 18 $ 55,8 88 33,3 27 5,966 11,964 8,7 84 115,9 29 Commercial paper Term debt Total current liabilities Non-current liabilities: Term debt Other non-current liabilities Total non-current liabilities 91,8 0 7 5 0,5 0 3 1 4 2,3 1 0 2 4 8,0 2 8 93,7 35 48,914 1 4 2,649 2 5 8,5 7 8 Total liabilities Commitments and contingencies Shareholders' equity: Common stock and additional paid-in capital, $0.00001 par value: 12,600,000 shares authorized: 4,443,236 and 4,754,986 shares issued and outstanding, respectively Retained earnings 4 5,1 74 4 5,898 40,201 70,400 Total current labilities 105,7 18 1 15,9 29 Non-current liabilities: Term debt Other non-current liabilities Total non-current liabilities Total liabilities 91,8 0 7 5 0,5 0 3 1 4 2,3 10 2 4 8,0 28 93,7 3 5 4 8,9 14 1 4 2,649 25 8,5 7 8 Commitments and contingencies Shareholders' equity: Common stock and additional paid-in capital, $0.00001 par value: 12,600,000 shares authorized; 4,443,236 and 4,754,986 shares issued and outstanding, respectively Retained earnings Accumulated other comprehensive income/(loss) Total shareholders' equity Total liabilities and shareholders' equity 45 , 17 4 45,898 (5 84 ) 90 , 4 8 8 $3 3 8,5 16 40,2 0 1 70,400 (3 4 5 4 107,1 47 $3 6 5,7 25 See accompanying Notes to Consolidated Financial Statements. Apple Inc. I 2019 Form 10-K131