Answered step by step
Verified Expert Solution
Question
1 Approved Answer
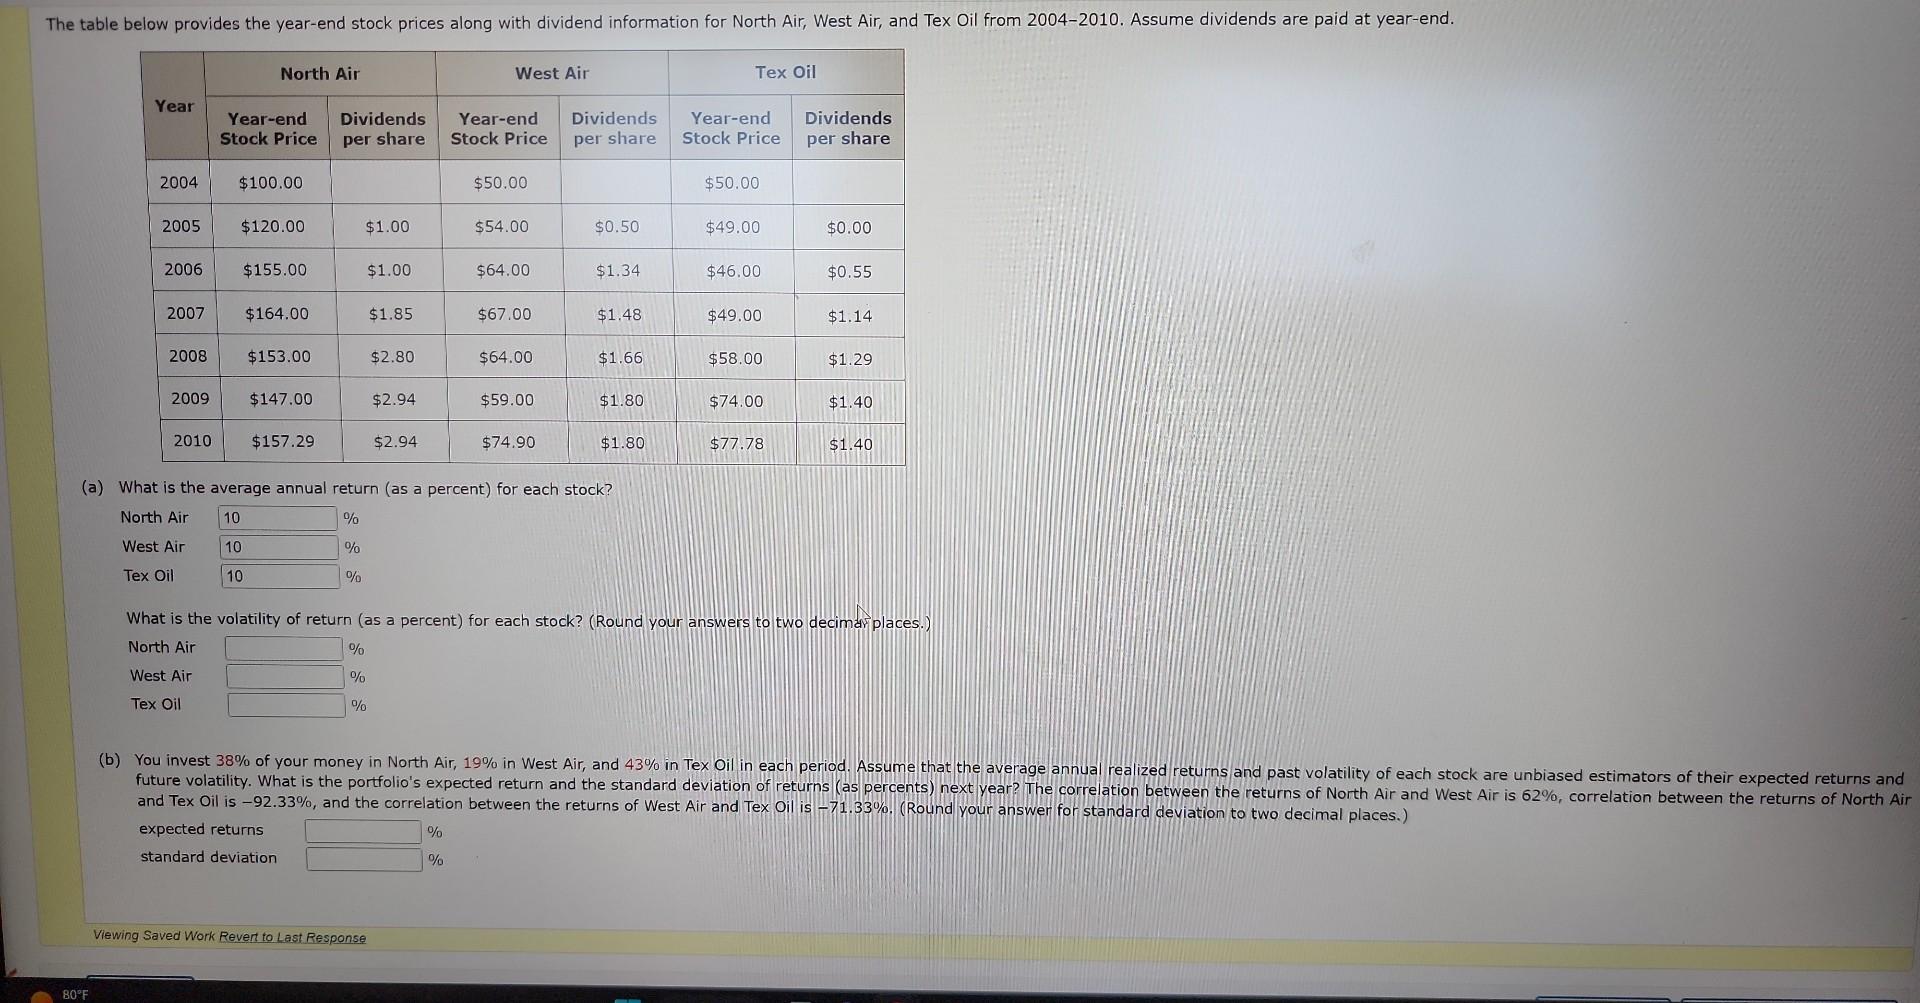
i need help with this question. begin{tabular}{|c|c|c|c|c|c|c|} hline multirow{2}{*}{ Year } & multicolumn{2}{|c|}{ North Air } & multicolumn{2}{|c|}{ West Air } & multicolumn{2}{|c|}{ Tex Oil

i need help with this question.
\begin{tabular}{|c|c|c|c|c|c|c|} \hline \multirow{2}{*}{ Year } & \multicolumn{2}{|c|}{ North Air } & \multicolumn{2}{|c|}{ West Air } & \multicolumn{2}{|c|}{ Tex Oil } \\ \cline { 2 - 7 } & Year-endStockPrice & Dividendspershare & Year-endStockPrice & Dividendspershare & Year-endStockPrice & Dividendspershare \\ \hline 2004 & $100.00 & $50.00 & & $50.00 & \\ \hline 2005 & $120.00 & $1.00 & $54.00 & $0.50 & $49.00 & $0.00 \\ \hline 2006 & $155.00 & $1.00 & $64.00 & $1.34 & $46.00 & $0.55 \\ \hline 2007 & $164.00 & $1.85 & $67.00 & $1.48 & $49.00 & $1.14 \\ \hline 2008 & $153.00 & $2.80 & $64.00 & $1.66 & $58.00 & $1.29 \\ \hline 2009 & $147.00 & $2.94 & $59.00 & $1.80 & $74.00 & $1.40 \\ \hline 2010 & $157.29 & $2.94 & $74.90 & $1.80 & $77.78 & $1.40 \\ \hline \end{tabular} (a) What is the average annual return (as a percent) for each stock? NorthAirWestAirTexOil101010%%% What is the volatility of return (as a percent) for each stock? (Round your answers to two decimanplaces.) expected returns standard deviation % Viewing Saved Work Revert to Last Response 80FStep by Step Solution
There are 3 Steps involved in it
Step: 1

Get Instant Access to Expert-Tailored Solutions
See step-by-step solutions with expert insights and AI powered tools for academic success
Step: 2

Step: 3

Ace Your Homework with AI
Get the answers you need in no time with our AI-driven, step-by-step assistance
Get Started


