I need help with this
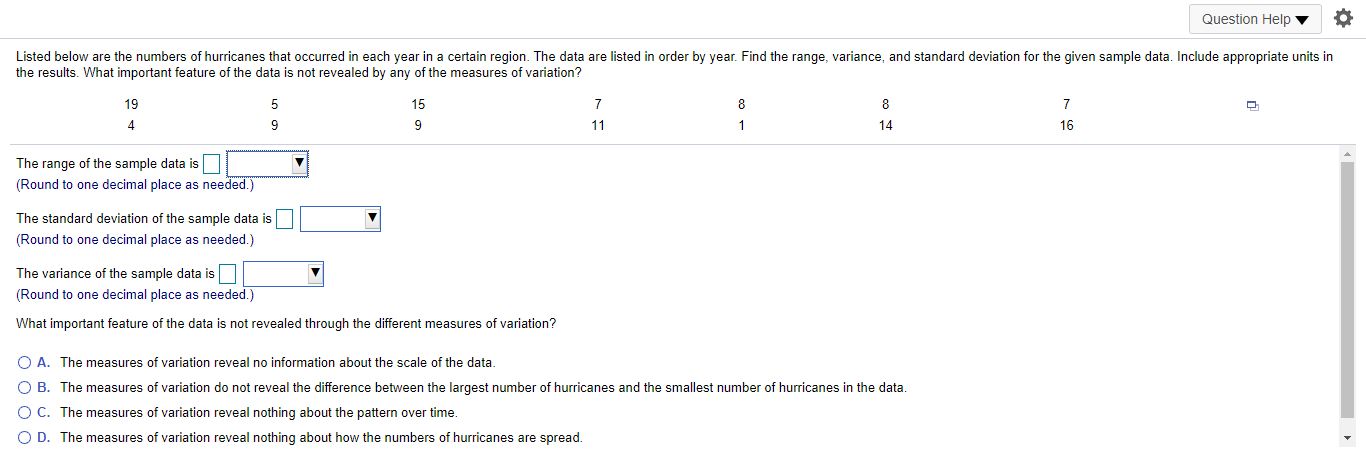
Question Help Listed below are the numbers of hurricanes that occurred in each year in a certain region. The data are listed in order by year. Find the range, variance, and standard deviation for the given sample data. Include appropriate units in the results. What important feature of the data is not revealed by any of the measures of variation? 19 15 Co - 00 11 14 16 The range of the sample data is (Round to one decimal place as needed.) The standard deviation of the sample data is (Round to one decimal place as needed.) The variance of the sample data is (Round to one decimal place as needed.) What important feature of the data is not revealed through the different measures of variation? O A. The measures of variation reveal no information about the scale of the data. O B. The measures of variation do not reveal the difference between the largest number of hurricanes and the smallest number of hurricanes in the data. O C. The measures of variation reveal nothing about the pattern over time. O D. The measures of variation reveal nothing about how the numbers of hurricanes are spread.The blood platelet counts of a group of women have a bell-shaped distribution with a mean of 250.7 and a standard deviation of 64.8. (All units are 1000 cells/L.) Using the empirical rule, find each approximate percentage below. a. What is the approximate percentage of women with platelet counts within 3 standard deviations of the mean, or between 56.3 and 445.1? b. What is the approximate percentage of women with platelet counts between 185.9 and 315.5? a. Approximately |% of women in this group have platelet counts within 3 standard deviations of the mean, or between 56.3 and 445.1. (Type an integer or a decimal. Do not round.) b. Approximately % of women in this group have platelet counts between 185.9 and 315.5. (Type an integer or a decimal. Do not round.)0.1 Use the following cell phone airport data speeds (Mbps) from a particular network. Find the percentile corresponding to the data speed 5.4 Mops. 0.1 0.7 0.2 0.7 0.3 0.5 1.8 0.8 0.8 0.5 2.1 0.6 5.2 2.2 0.8 2.5 0.8 0.6 5.4 5.5 2.8 1.1 0.6 2.8 1.2 0.70 10.3 1.3 10.9 6.8 11.4 7.5 2.9 11.5 7.7 3.3 1.5 8.2 3.4 11.6 9.9 4.2 Percentile of 5.4=] 12.9 14.8 10.2 15.5 10.3 (Round to the nearest whole number as needed.) 15.8 28.7Use the following cell phone airport data speeds (Mbps) from a particular network. Find Q3. Question Help 0.1 0.2 0.7 0.2 0.8 0.4 0.4 1.8 0.8 0.9 0.5 2.1 2.4 0.9 0.5 2.4 1.1 0.5 4.5 4.6 1.1 0.6 5.3 2.7 2.9 1.6 0.7 10.4 6.1 2.9 1.7 11.4 11.8 6.2 6.7 3.6 1.7 11.9 7.4 3.9 12.5 8.2 4.5 Q3 = Mbps 12.5 14.6 8.2 14.6 9.4 15.7 (Type an integer or a decimal. Do not round.) 27.3The following are the ratings of males by females in an experiment involving speed dating. Use the given data to construct a boxplot and identify the 5-number summary. 1.0 1.0 2.0 3.0 3.5 3.5 4.5 4.5 4.5 4.5 4.5 5.5 6.0 7.0 7.0 7.0 8.0 8.5 9.5 9.5 The 5-number summary is,. . , and]. (Use ascending order. Type integers or decimals. Do not round.) Which boxplot below represents the data? O A. O B. 2 4 6 8 2 4 6 8 10 Ratings Ratings O C. OD. 2 4 6 10 2 4 6 8 10 Ratings Ratings


