I need help with this question:
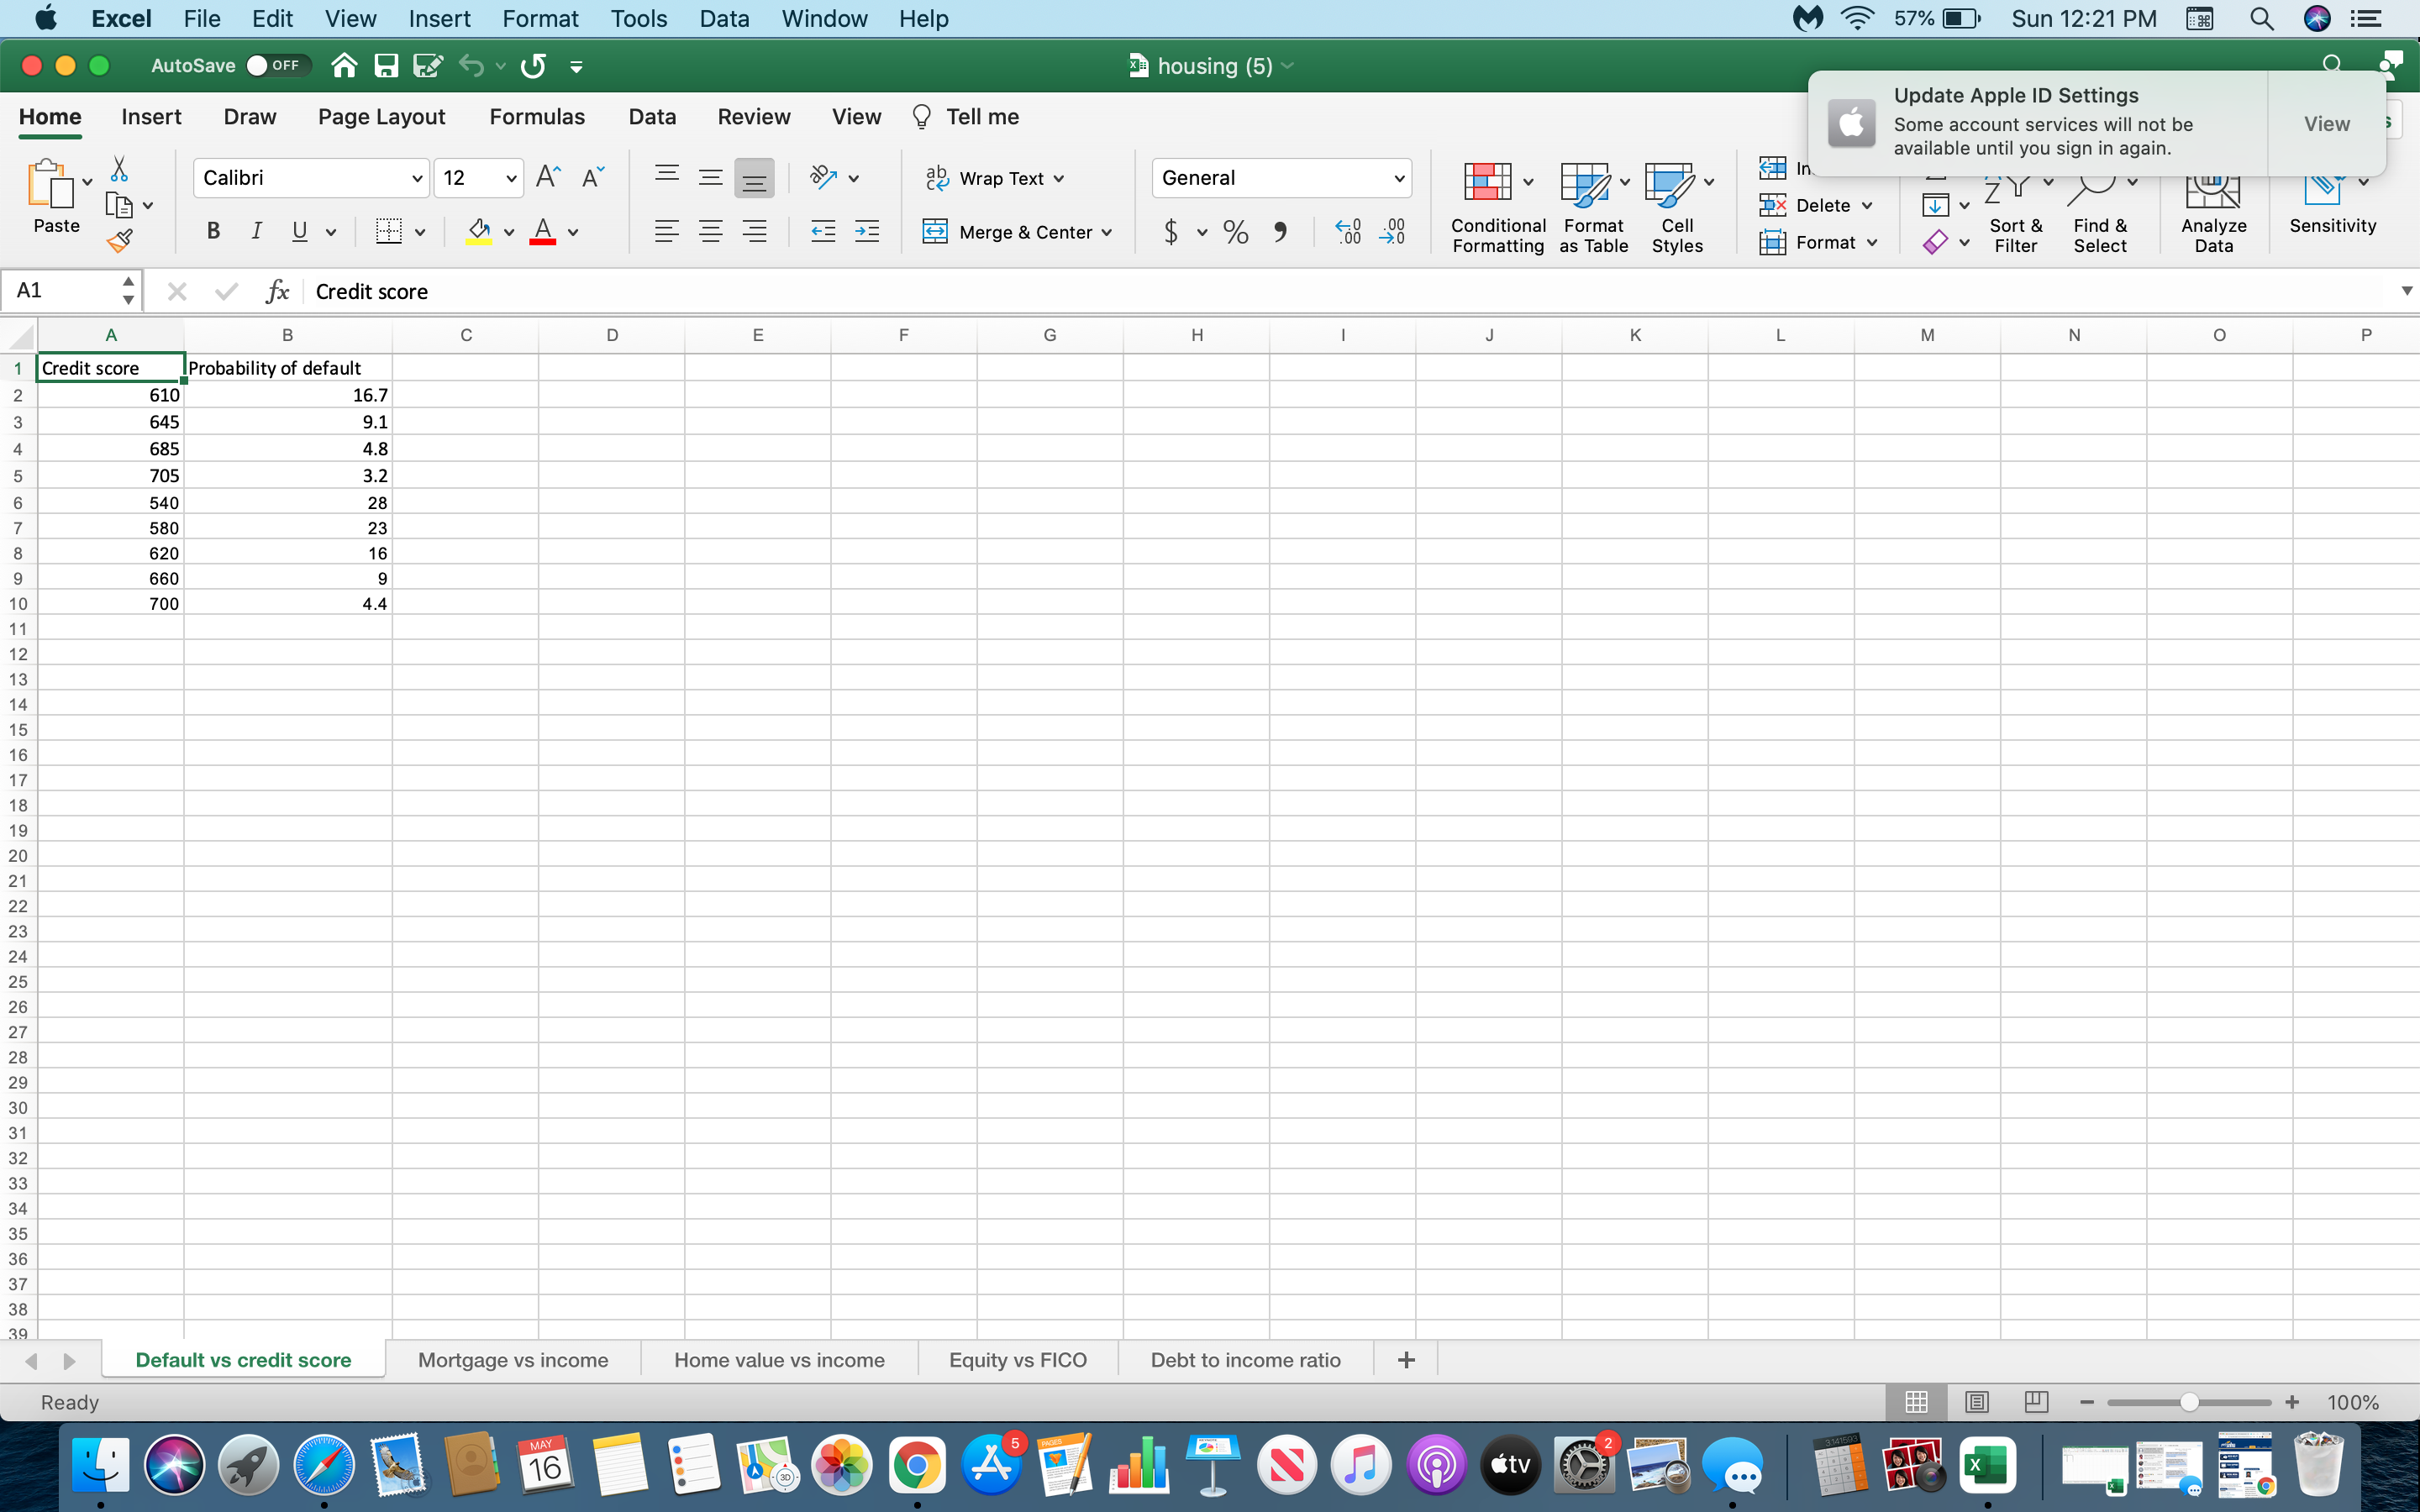
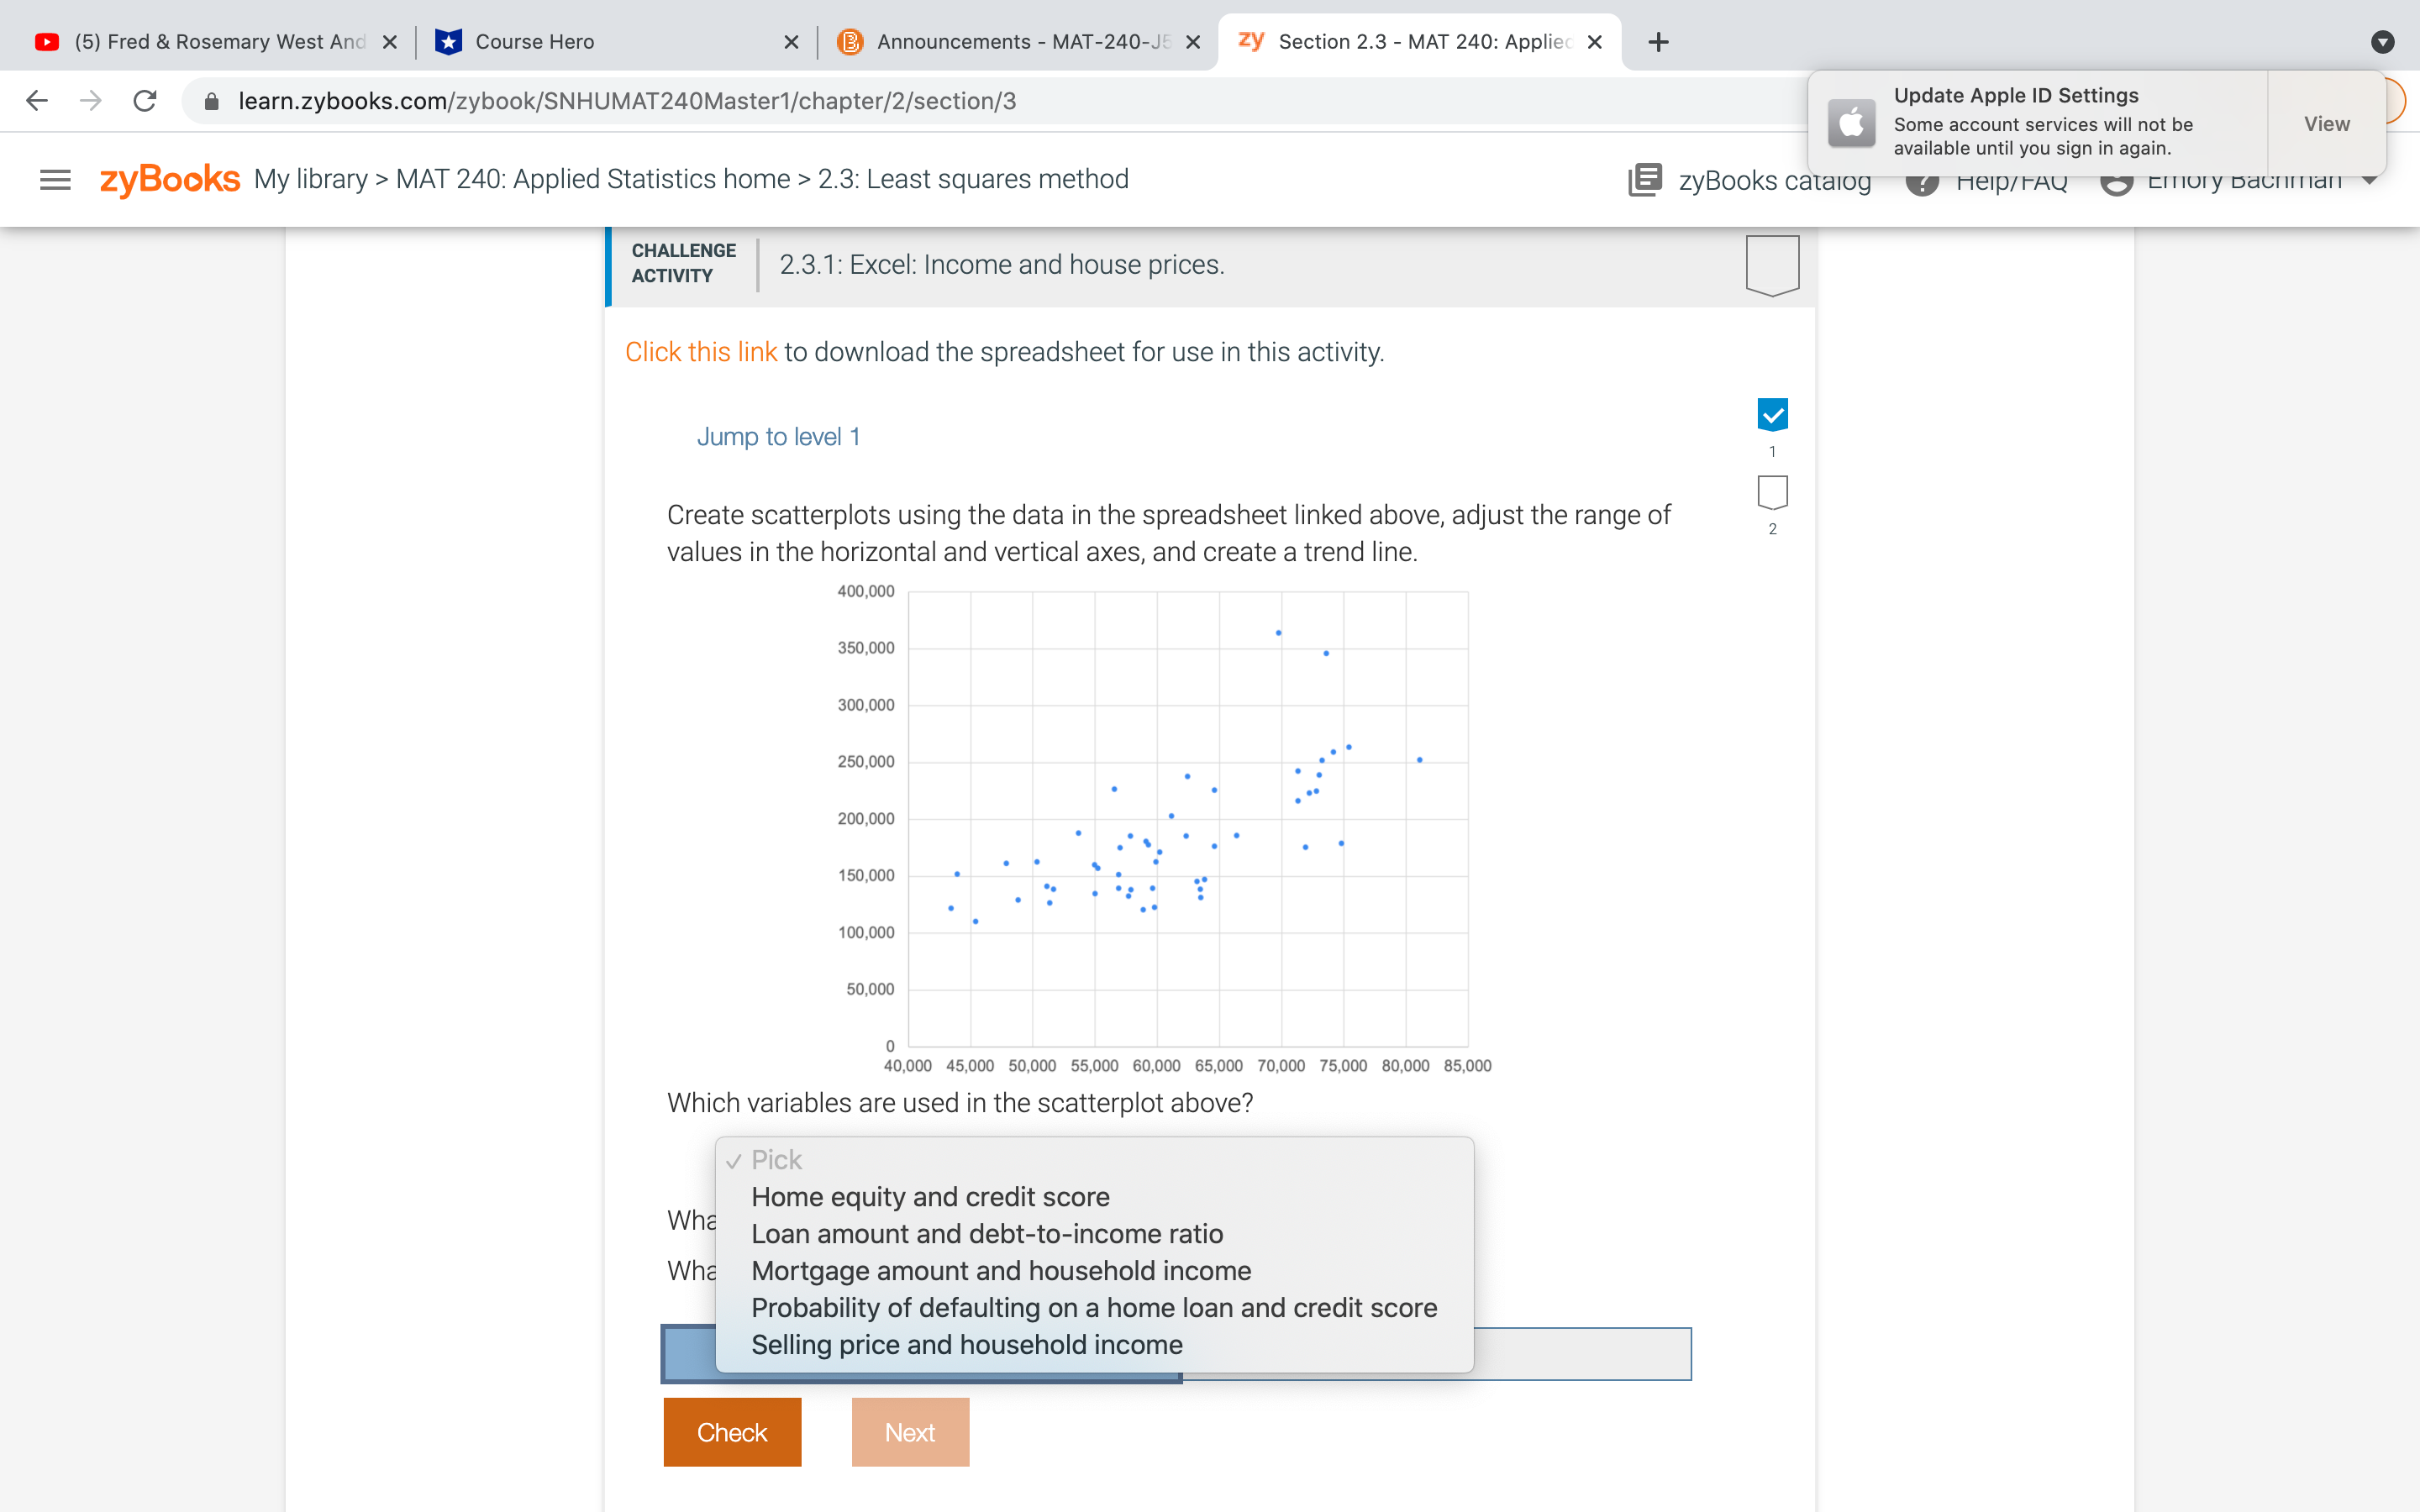
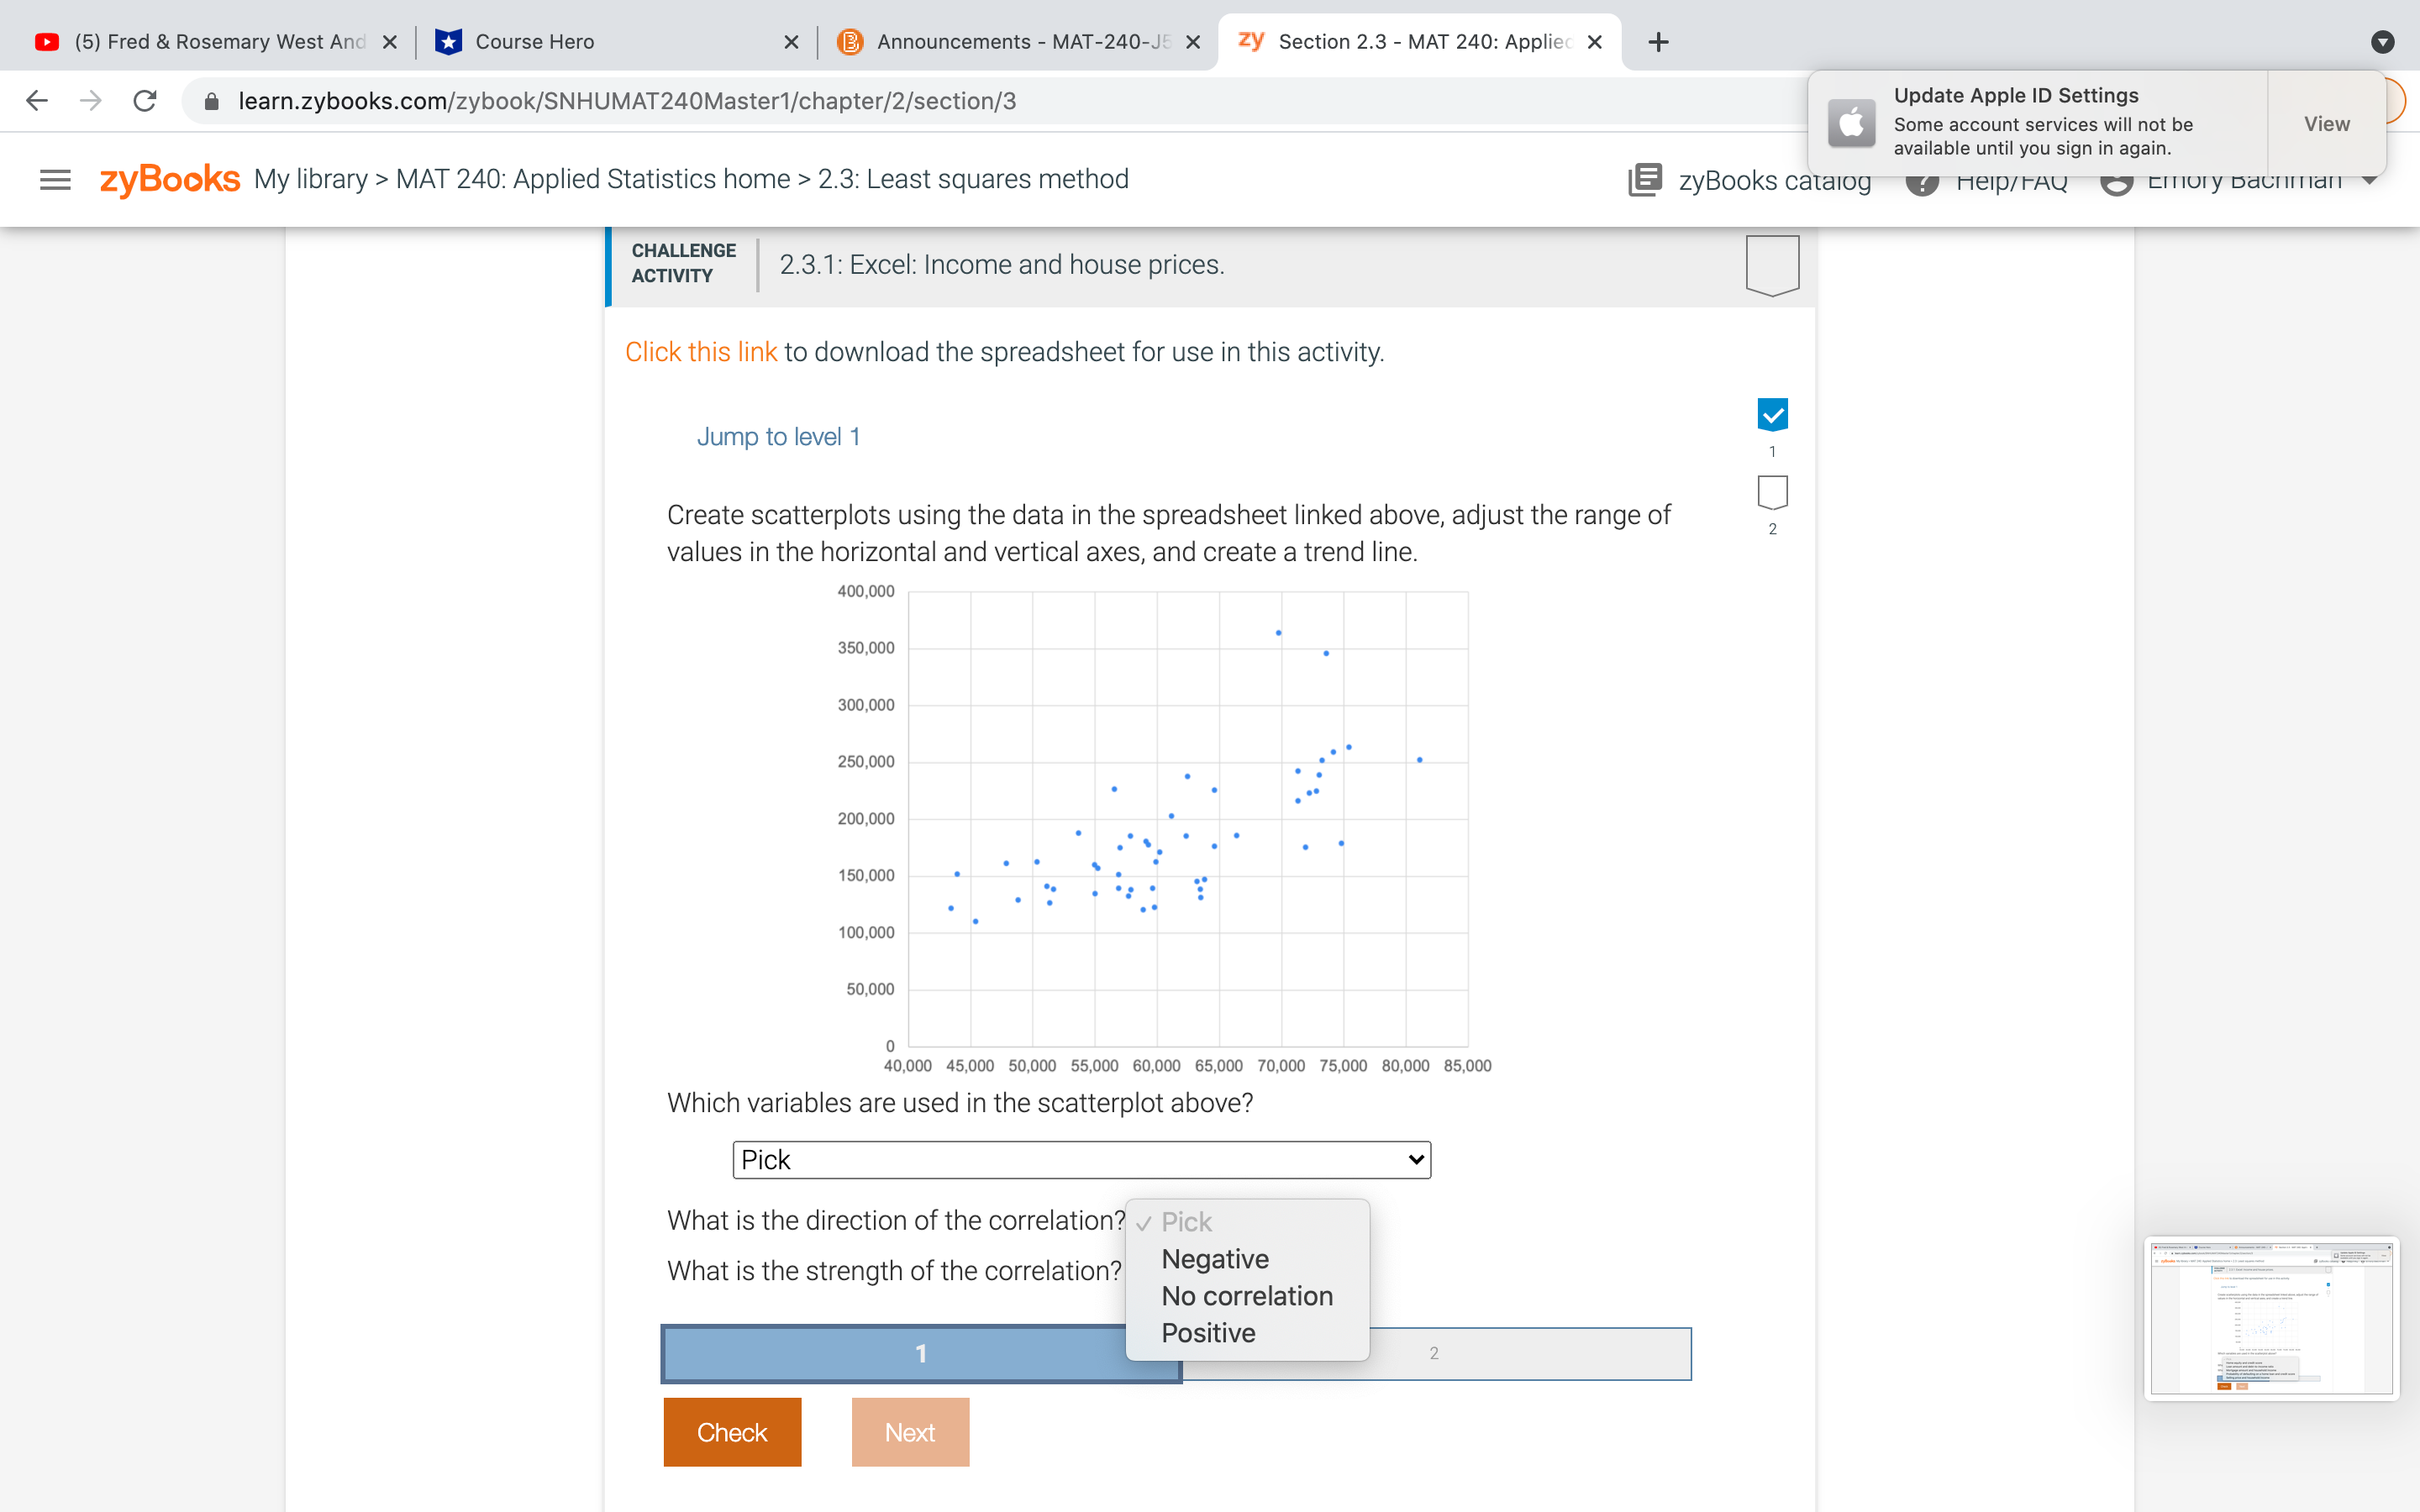
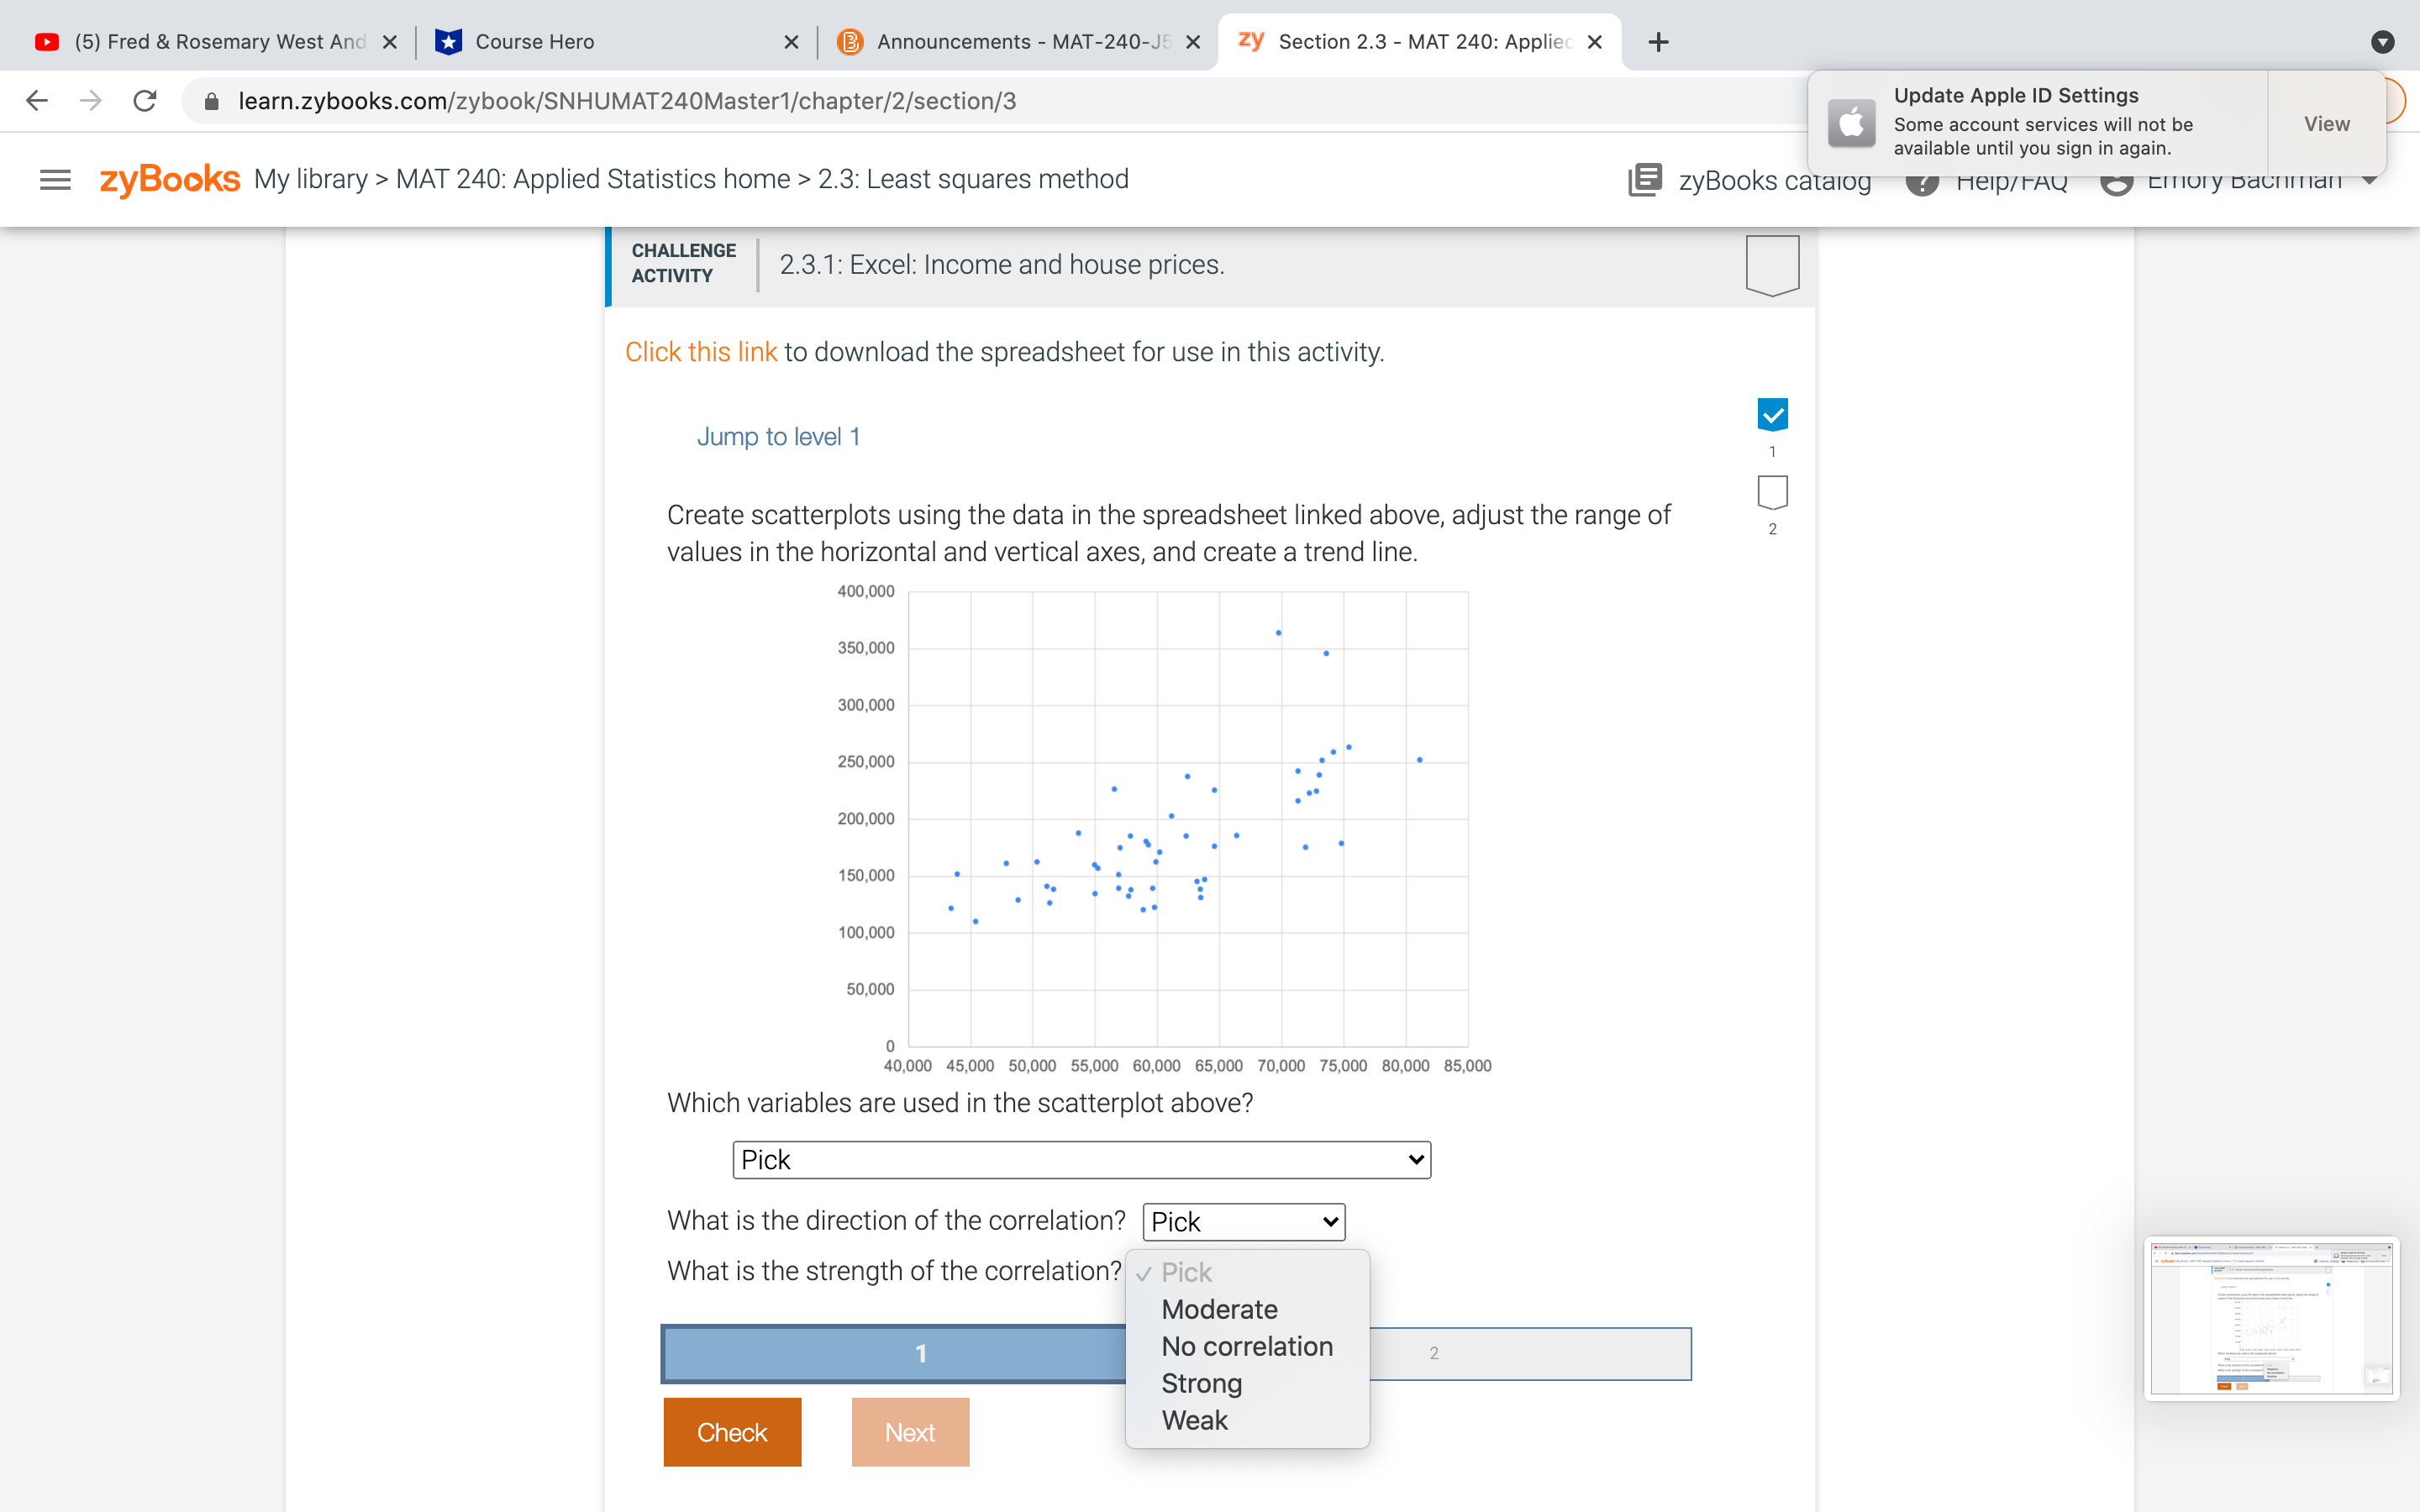
Home ' Excel Insert File Edi! Draw Calibri BIQv View Page Layout Insert Format Formulas Tools Data Data Window Help Review View 79w :2 b: q: H housing (5) 9 Tell me Wrap Text v General $~%a Merge & Center v '3 0 D .0 a 0 11 v @v Conditional Format Formatting as Table Cell styles 8 E I 57% I Sun12:21 PM Q o Update Apple ID Se ngs Some account services will not be available until you sign in again. :5 Delete v E Format v i i i v ZY /V ES Sort& Find& Analyze 0 V Filter Select Data Sensitivity c Credit score B @muuna 9 10 11 12 13 14 15 16 17 18 19 20 21 22 23 24 25 26 27 25 29 30 31 32 33 34 35 36 37 38 19 45' 610 645 655 705 540 580 620 $60 700 Credit score IProbability of default 16.7 9.1 4.8 3.2 28 23 16 9 4.4 Default vs credit score Mortgage vs income ' Home Value vs income Equity vs FICO Debt to income ratio + Ready u (5) Fred & Rosemary West And X I u Course Hero MAT 240: Applied Statistics home > 2.3: Least squares method CHALLENGE x I @ Announcements-MAT-ZAO-JE X zy Section 2.3- MAT 240: Appller x + i learn.zybooks.com/zybook/SNHUMAT240Master1/chapter/Z/section/3 mm\a (5) Fred &Rosemary West And X I u Course Hero x I @ Announcements - MAT-ZAO-JE > MAT 240: Applied Statistics home > 2.3: Least squares method :01." ILVLIETCGE I 231: Excel: Income and house prices Click this link to download the spreadsheet for use in this activity. Jump to level 1 , U 1 Create scatterplots using the data in the spreadsheet linked above. adjust the range of values in the horizontal and vertical axes, and create a trend line. 400.000 350,000 ~ 300,000 250,000 : ' - 200.000 . ' 150,000 100,000 50,000 0 40.000 45,000 50,000 55,000 50,000 65,000 70,000 75,000 80,000 85.000 Which variables are used in the scatterplot above? Pick v What is the direction of the correlation. Pick Negative No correlation Positive What is the strength of the correlation? a (5) Fred &Rosemary West And X I u Course Hero x I @ Announcements - MAT-ZAO-JE > MAT 240: Applied Statistics home > 2.3: Least squares method :01." ILVLIETCGE I 231: Excel: Income and house prices Click this link to download the spreadsheet for use in this activity. Jump to level 1 , U 1 Create scatterplots using the data in the spreadsheet linked above. adjust the range of values in the horizontal and vertical axes, and create a trend line. 400.000 350,000 . 300,000 250,000 : ' - 200.000 . ' 150,000 100,000 50,000 0 40.000 45,000 50,000 55,000 50,000 65,000 70,000 75,000 00,000 85.000 Which variables are used in the scatterplot above? Pick v| What is the direction of the correlation? Pick v What is the strength of the correlation? Pick Moderate No correlation Strong Weak


