

Answered step by step
Verified Expert Solution
Question
1 Approved Answer
I need help working these ratios Activity Ratios Inventory Turnover Accounts Receivables Turnover Total Asset Turnover Average Collection Period 3. Using the data from the
I need help working these ratios 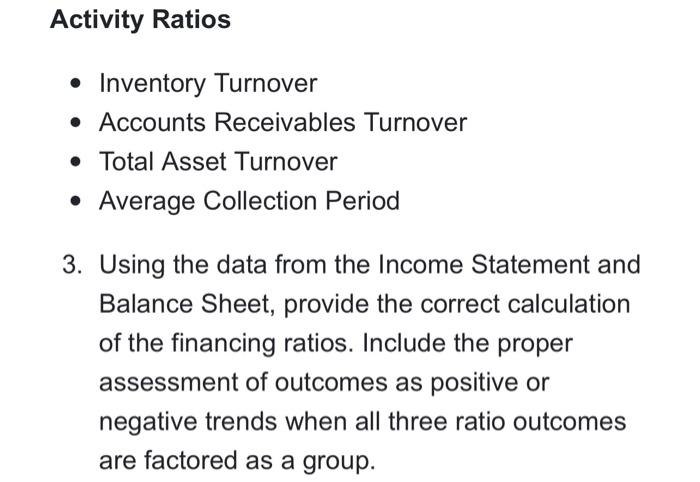

Activity Ratios Inventory Turnover Accounts Receivables Turnover Total Asset Turnover Average Collection Period 3. Using the data from the Income Statement and Balance Sheet, provide the correct calculation of the financing ratios. Include the proper assessment of outcomes as positive or negative trends when all three ratio outcomes are factored as a group. Period Ending Total Sales Cost of Goods Sold Gross Profit Selling General and Adminstrative Operating Profit Total Other Income/Expenses Net Earnings before Interest and Taxes Interest Expense Income Before Tax Income Tax Expense Net Income from Continuing Ops Discontinued Operations Net Income (Net Profit) 14,000,000 Shares outstanding Market Share price per share ABC Company Balance Sheet Period Ending Assets Current Assets Cash and Cash Equivalents Net Receivables Inventory Other Current Assets Total Current Assets Property Plant and Equipment Goodwill Other Assets Total Assets ABC Company Income Statement 31-Dec-15 $485,651,000 365,086,000 120,565,000 93,418,000 27,147,000 113,000 27,034,000 2,461,000 24,573,000 7,985,000 16,588,000 285,000 $16,303,000 $10.00 2015 59,135,000 6,778,000 45,141,000 2,224,000 63,278,000 116,655,000 18,102,000 5,671,000 203,706,000 31-Dec-14 $476,294,000 358,069,000 118,225,000 91,353,000 26,872,000 119,000 26,753,000 2,335,000 24,418,000 8,105,000 16,313,000 144,000 $16,169,000 $9.00 31-Dec-13 $475,210,000 350,400,000 124,810,000 90,343,000 34,467,000 115,000 34,352,000 2,200,000 32,152,000 9,800,000 22,352,000 182,000 $22,170,000 $8.50 2014 2013 $7,281,000 56,789.000 6,677,000 6,525,000 44,858,000 43,999,000 2,369,000 2,199,000 61,185,000 59,502,000 117,907,000 120,300,000 19,510,000 17,900,000 6,149,000 4,500,000 204,751,000 202,202,000 Current Liabilities Accounts Payable Other current Liabilities Short-term Debt Total Current Liabilities Long-term Debt Deferred Long-term Liability charges Monority interest Total Liablities Miscellaneous Stock Options Warrants Common Stock Retained Earnings Captal Surplus Other Stockholders Equity Total Stockholders Equity Total Liabilities & Steckholders Equity of Shares Outstanding Market share price per share 2015 58,583.000 6.689,000 65,272,000 43,692,000 8,805,000 4,543,000 122,312,000 0 323,000 85,777,000 2.462.000 -7,168,000 81,394,000 203,706,000 14,000,000 $10.00 2014 57,174,000 89,000 12,082,000 69,345,000 44,559,000 8,017,000 5,084,000 127,000,000 O 323,000 76,566,000 2,362,000 -1,505,000 77,746,000 204.751,000 14,000,000 $9.00 2013 56,210,000 55.000 14.050,000 70,315,000 45,324,000 13,553,000 6,875,000 136,067,000 0 323,000 65,750.000 2.262.000 2,200,000 66,135,000 202,202,000 14,000,000 $8.50 Step by Step Solution
There are 3 Steps involved in it
Step: 1

Get Instant Access to Expert-Tailored Solutions
See step-by-step solutions with expert insights and AI powered tools for academic success
Step: 2

Step: 3
Ace Your Homework with AI
Get the answers you need in no time with our AI-driven, step-by-step assistance
Get Started
Trade Union Finance
Authors: Marick F. Masters, Raymond Gibney
1st Edition
1032371382, 978-1032371382