I need help writing thise code
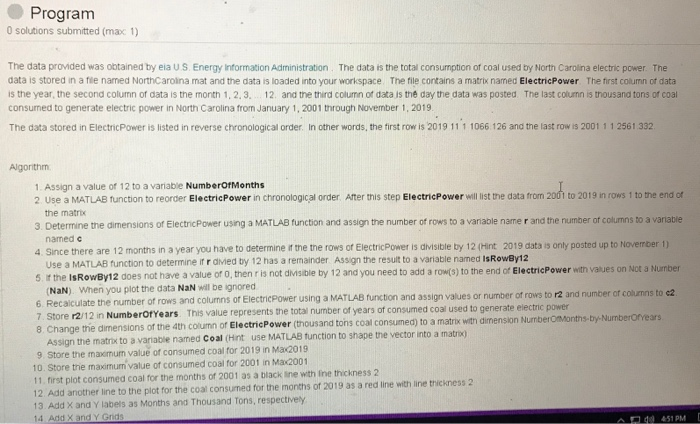
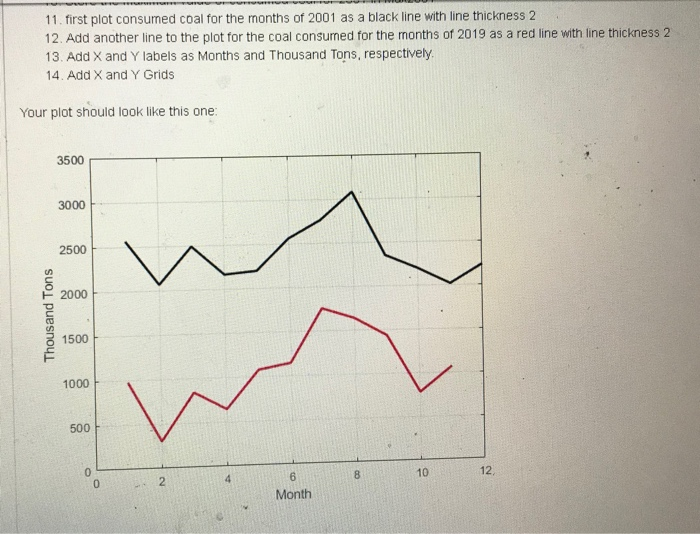
Program O solutions submitted (max) The data provided was obtained by a US Energy information Administration. The data is the total consumption of coal used by North Carolina electric power. The data is stored in a file named North Carolina mat and the data is loaded into your workspace. The file contains a matramed Electric Power The first column of data is the year, the second column of data is the month 1.2.3. 12 and the third column of data is the day the data was posted The last column is thousand tons of coal consumed to generate electric power in North Carolina from January 1, 2001 through November 1, 2019 The data stored in Electric Power is listed in reverse chronological order in other words, the first row is 2019 11 1 1066 126 and the last row is 2001 1 1 2561 332 Algorithm 1. Assign a value of 12 to a variable NumberOfMonths 2. Use a MATLAB function to reorder Electric Power in chronological order. After this step Electric Power will list the data from 2001 to 2019 in rows to the end of the matrix 3. Determine the dimensions of Electric Power using a MATLAB function and assign the number of rows to a variable namer and the number of columns to a variable named c 4. Since there are 12 months in a year you have to determine the the rows of Electric Power is divisible by 12 (Hint 2019 data is only posted up to November 1) Use a MATLAB function to determine ir dvied by 12 has a remainder Assign the result to a variable named Is RowBy12 5. the IsRowBy12 does not have a value of O, then is not visible by 12 and you need to add a row(s) to the end of Electric Power with values on Not a Number (NaN). When you plot the data NaN will be ignored 6. Recalculate the number of rows and columns of Electric Power using a MATLAB function and assign values or number of rows to r2 and number of columns to c2 7. Store r2/12 in Number of years. This value represents the total number of years of consumed coal used to generate electric power 8. Change the dimensions of the 4th column of Electric Power (thousand tons coal consumed) to a matrix with dimension Number Months-byNurnberOfYears Assign the matrix to a variable named Coal (Hint use MATLAB function to shape the vector into a matrix) 9. Store the maximum value of consumed coal for 2019 in Max 2019 10. Store the maximum value of consumed coal for 2001 in Max 2001 11. first plot consumed coal for the months of 2001 as a black ine within thickness 2 12. Add another line to the plot for the coal consumed for the months of 2019 as a red line with line thickness 2 13. Add X and Y labels as Months and Thousand Tons, respectively 14 Add X and Y Grids 11. first plot consumed coal for the months of 2001 as a black line with line thickness 2 12. Add another line to the plot for the coal consumed for the months of 2019 as a red line with line thickness 2 13. Add X and Y labels as Months and Thousand Tons, respectively 14. Add X and Y Grids Your plot should look like this one: 3500 3000 2500 Thousand Tons 1000 500 OO 24 Month Program O solutions submitted (max) The data provided was obtained by a US Energy information Administration. The data is the total consumption of coal used by North Carolina electric power. The data is stored in a file named North Carolina mat and the data is loaded into your workspace. The file contains a matramed Electric Power The first column of data is the year, the second column of data is the month 1.2.3. 12 and the third column of data is the day the data was posted The last column is thousand tons of coal consumed to generate electric power in North Carolina from January 1, 2001 through November 1, 2019 The data stored in Electric Power is listed in reverse chronological order in other words, the first row is 2019 11 1 1066 126 and the last row is 2001 1 1 2561 332 Algorithm 1. Assign a value of 12 to a variable NumberOfMonths 2. Use a MATLAB function to reorder Electric Power in chronological order. After this step Electric Power will list the data from 2001 to 2019 in rows to the end of the matrix 3. Determine the dimensions of Electric Power using a MATLAB function and assign the number of rows to a variable namer and the number of columns to a variable named c 4. Since there are 12 months in a year you have to determine the the rows of Electric Power is divisible by 12 (Hint 2019 data is only posted up to November 1) Use a MATLAB function to determine ir dvied by 12 has a remainder Assign the result to a variable named Is RowBy12 5. the IsRowBy12 does not have a value of O, then is not visible by 12 and you need to add a row(s) to the end of Electric Power with values on Not a Number (NaN). When you plot the data NaN will be ignored 6. Recalculate the number of rows and columns of Electric Power using a MATLAB function and assign values or number of rows to r2 and number of columns to c2 7. Store r2/12 in Number of years. This value represents the total number of years of consumed coal used to generate electric power 8. Change the dimensions of the 4th column of Electric Power (thousand tons coal consumed) to a matrix with dimension Number Months-byNurnberOfYears Assign the matrix to a variable named Coal (Hint use MATLAB function to shape the vector into a matrix) 9. Store the maximum value of consumed coal for 2019 in Max 2019 10. Store the maximum value of consumed coal for 2001 in Max 2001 11. first plot consumed coal for the months of 2001 as a black ine within thickness 2 12. Add another line to the plot for the coal consumed for the months of 2019 as a red line with line thickness 2 13. Add X and Y labels as Months and Thousand Tons, respectively 14 Add X and Y Grids 11. first plot consumed coal for the months of 2001 as a black line with line thickness 2 12. Add another line to the plot for the coal consumed for the months of 2019 as a red line with line thickness 2 13. Add X and Y labels as Months and Thousand Tons, respectively 14. Add X and Y Grids Your plot should look like this one: 3500 3000 2500 Thousand Tons 1000 500 OO 24 Month