I need helpp A simple random sample of size n = 15 is drawn from a population that is normally distributed. The sample mean is
I need helpp
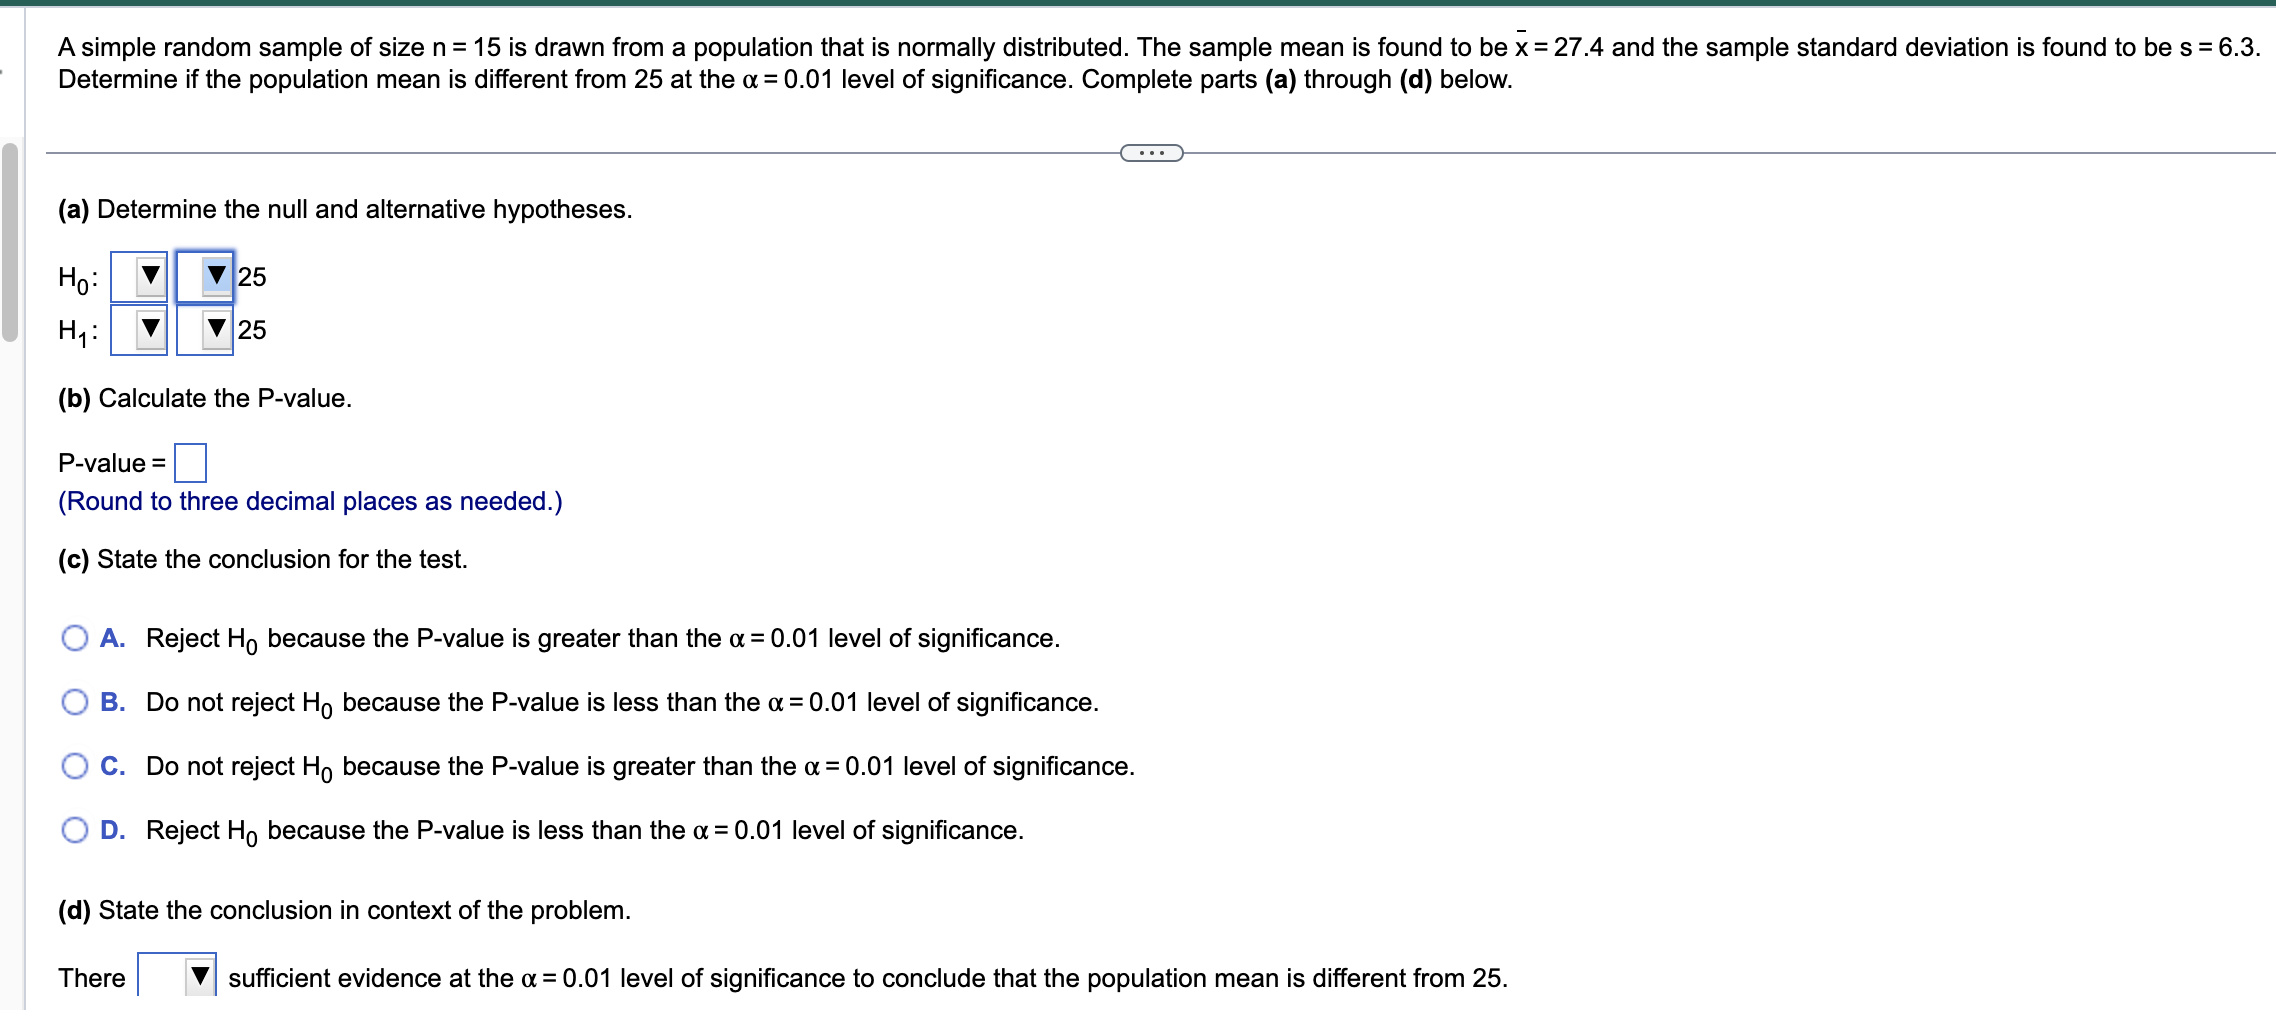
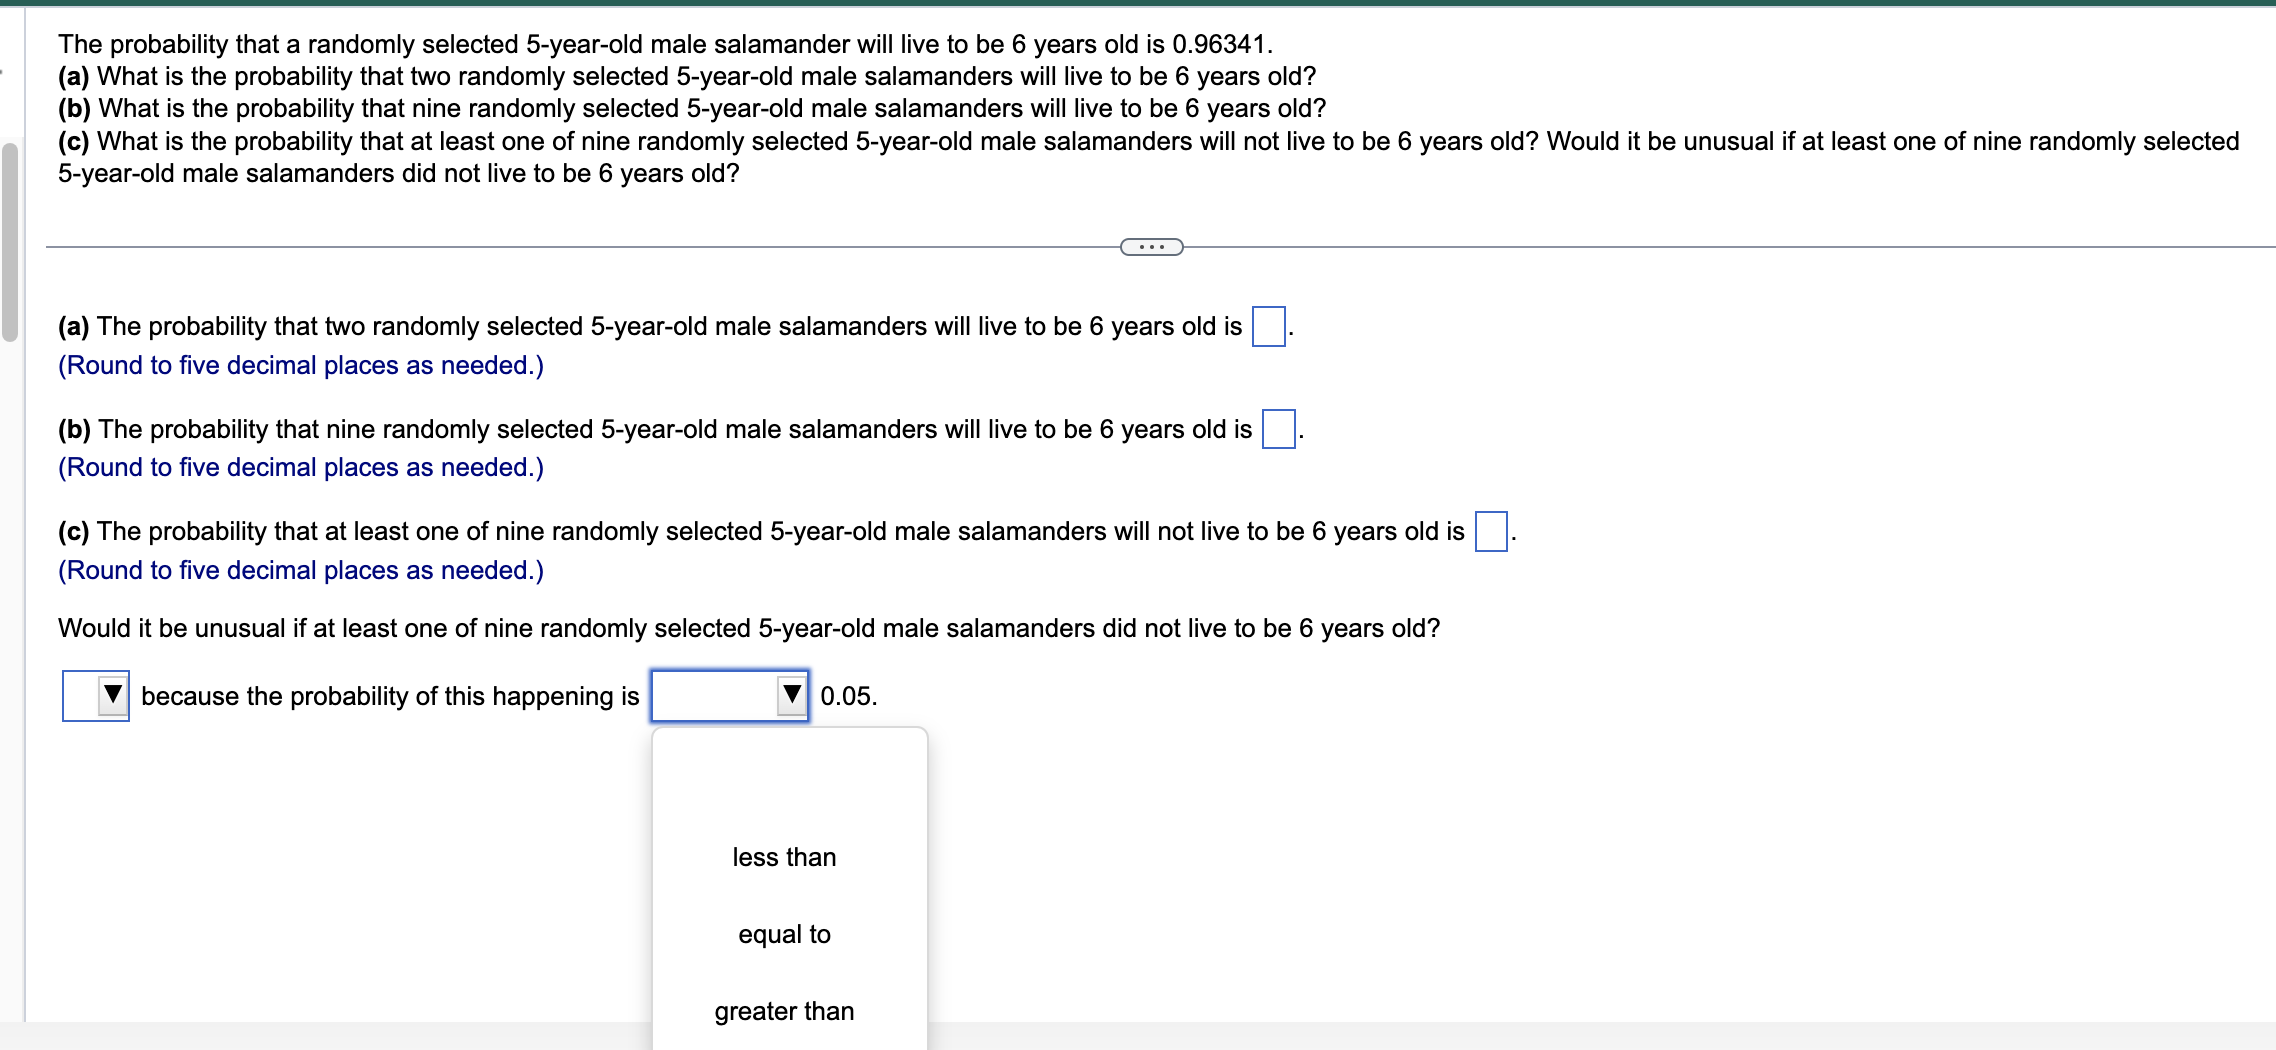
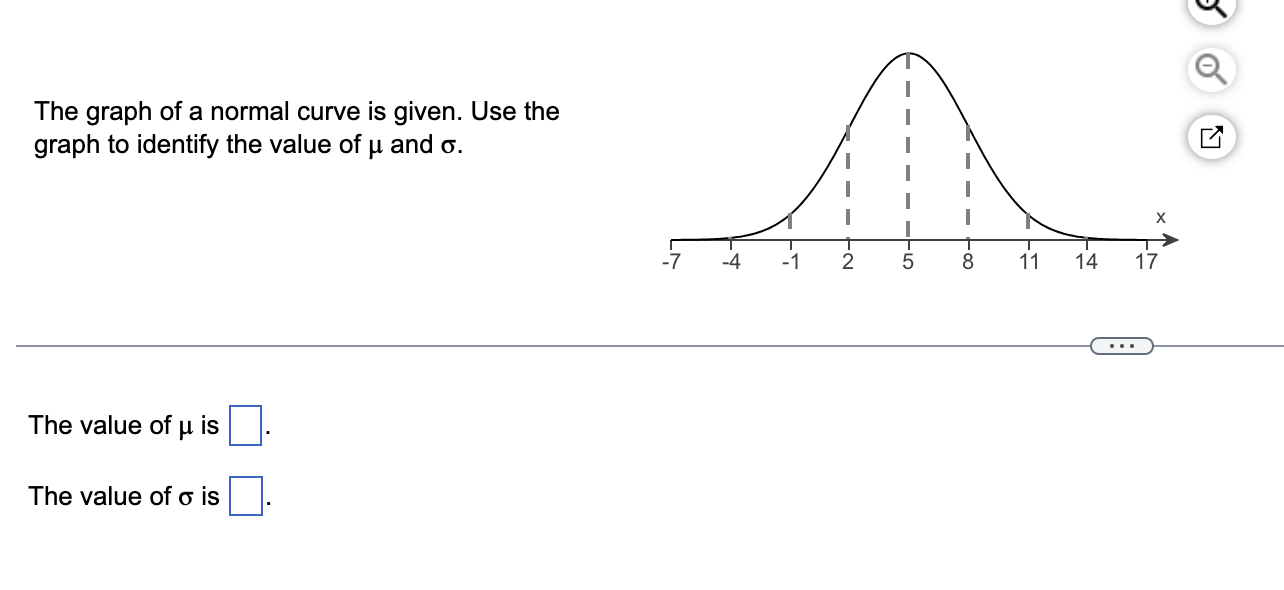
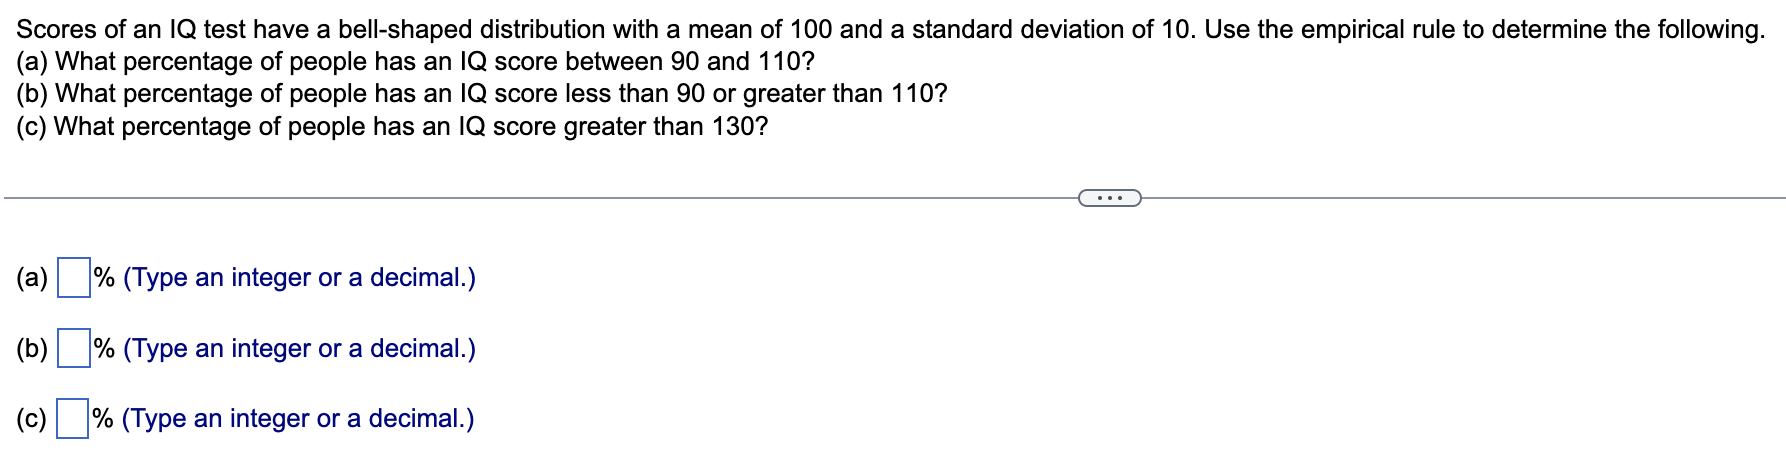
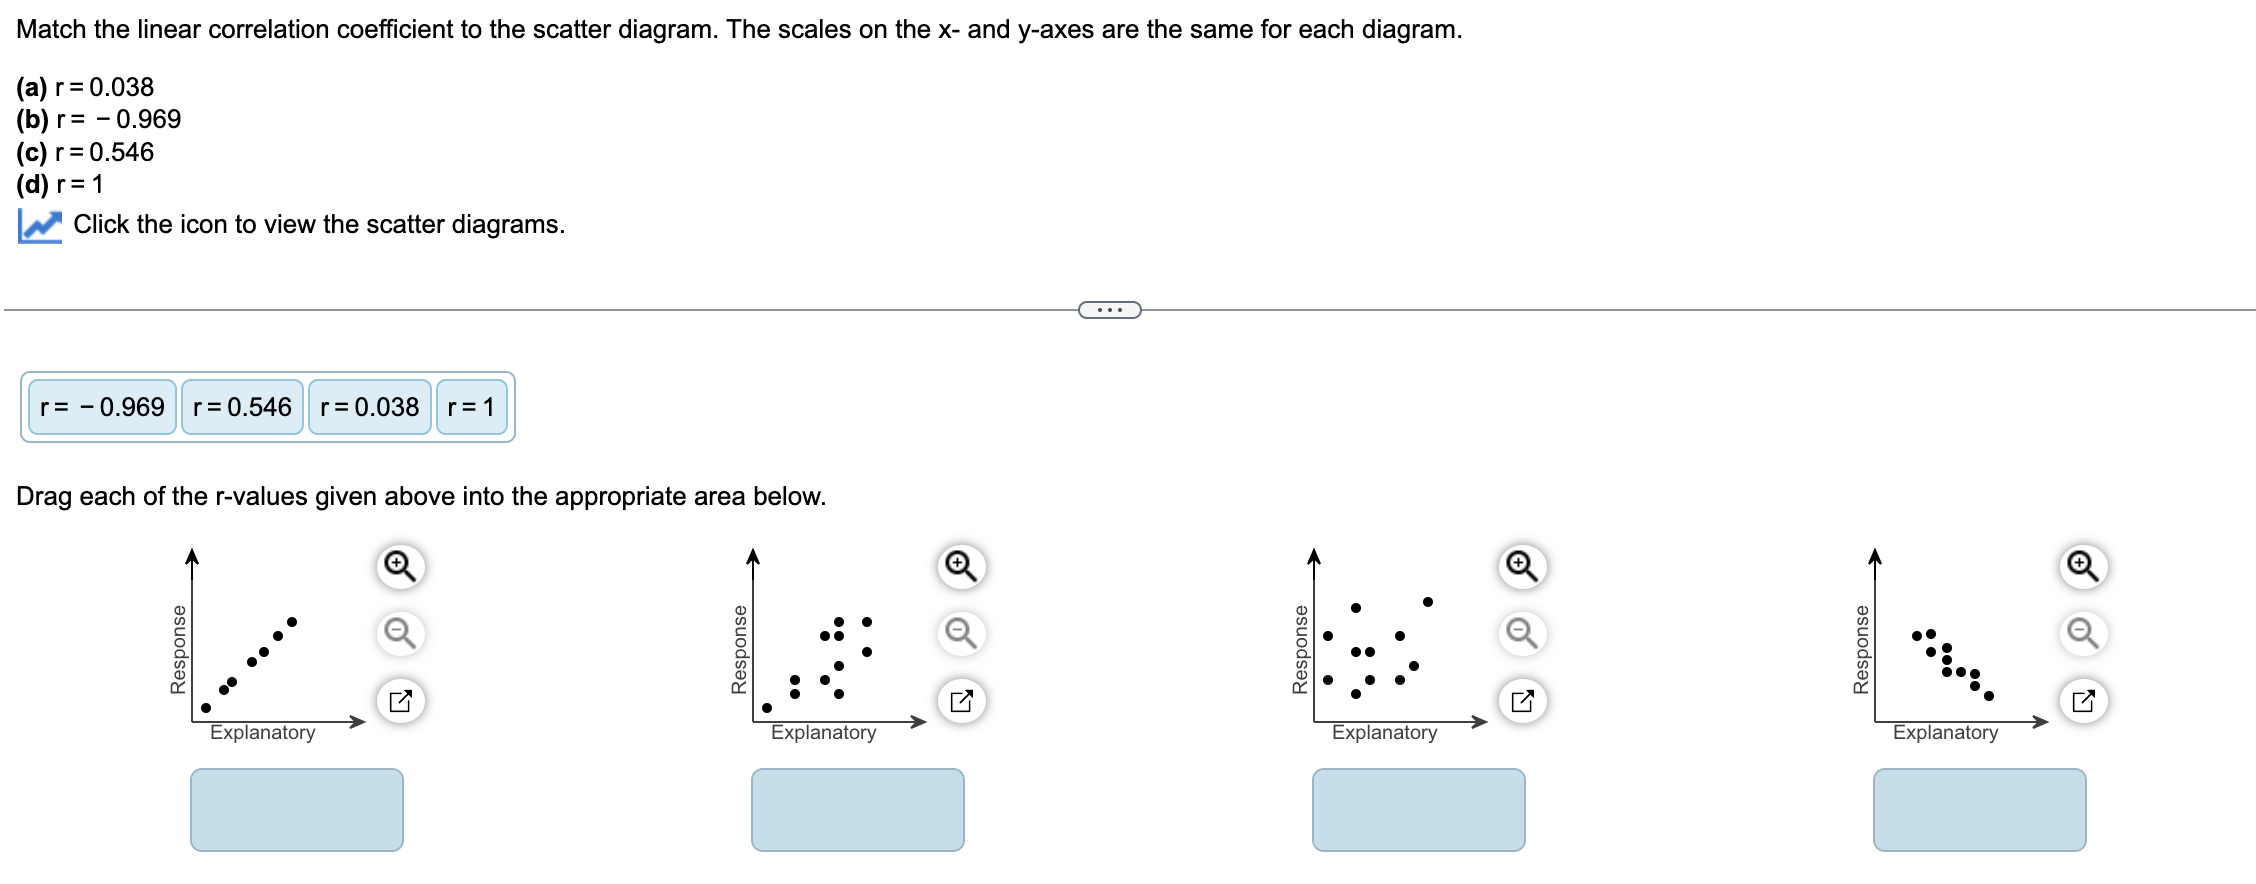
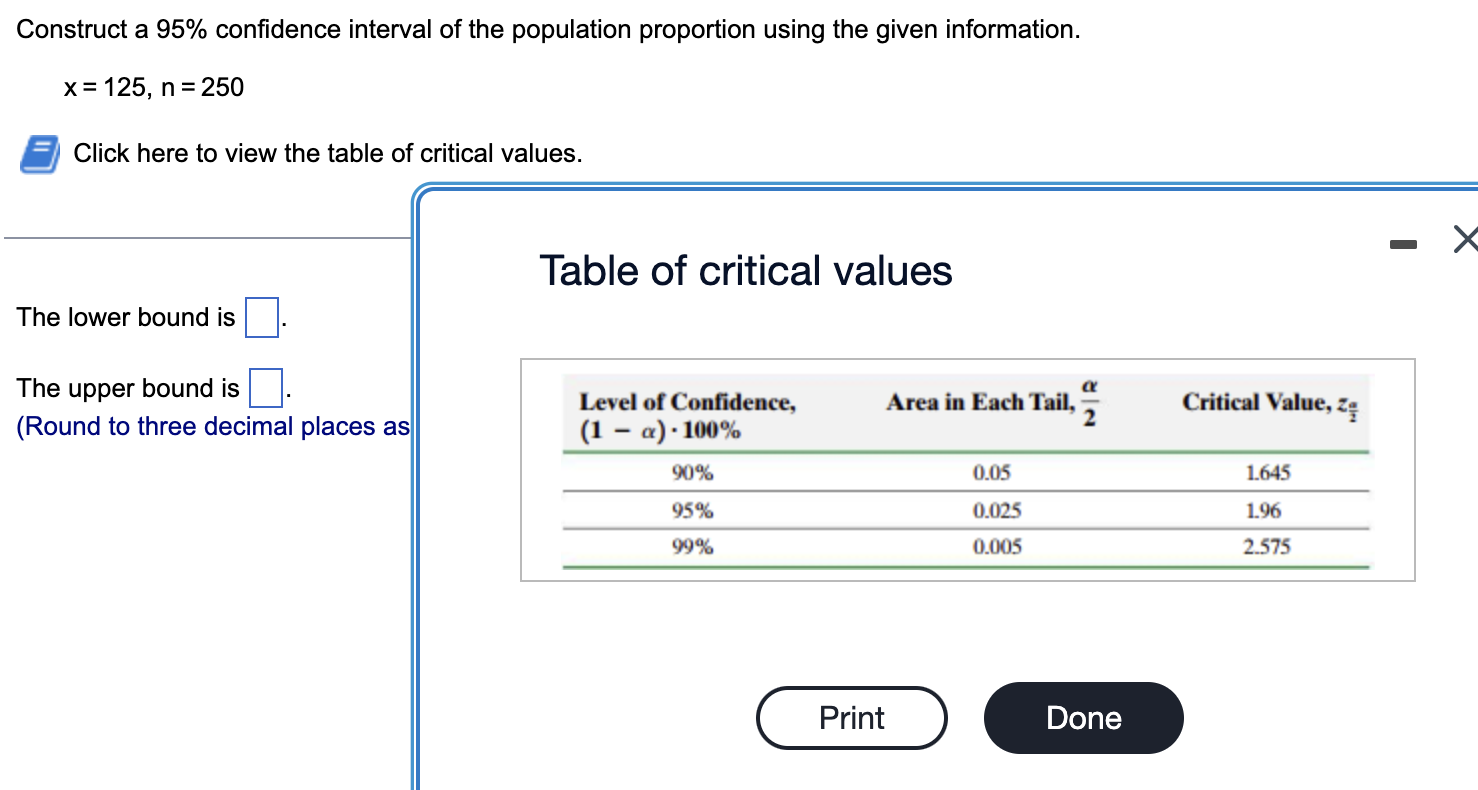
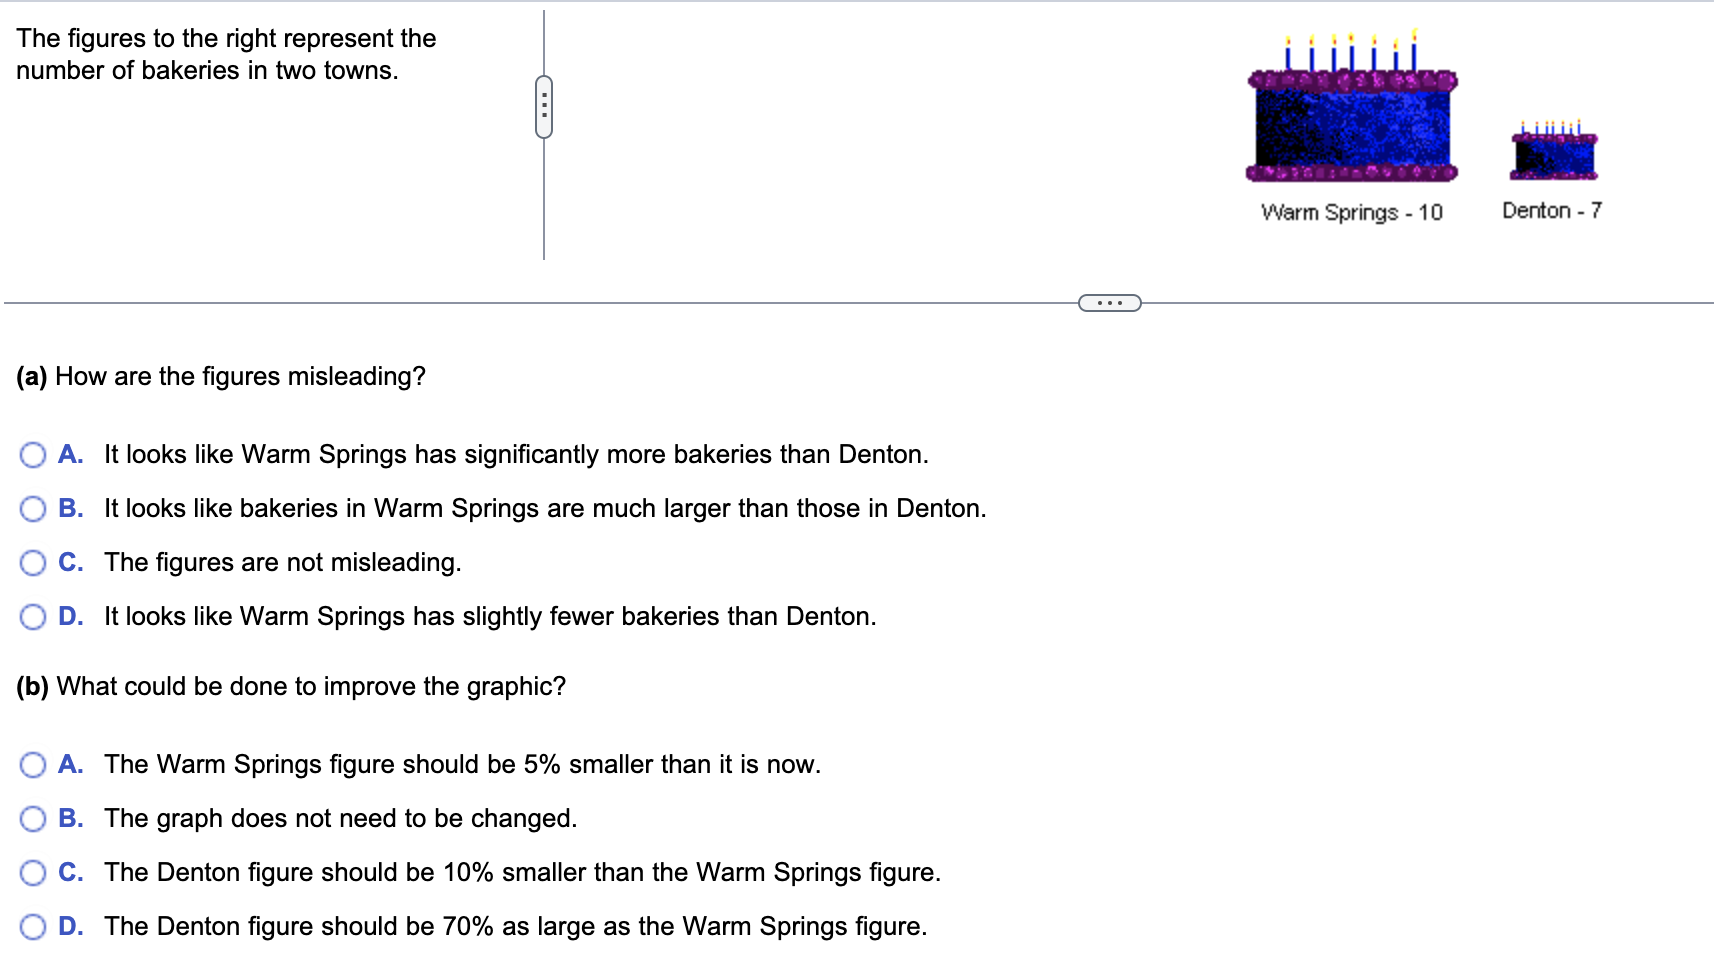
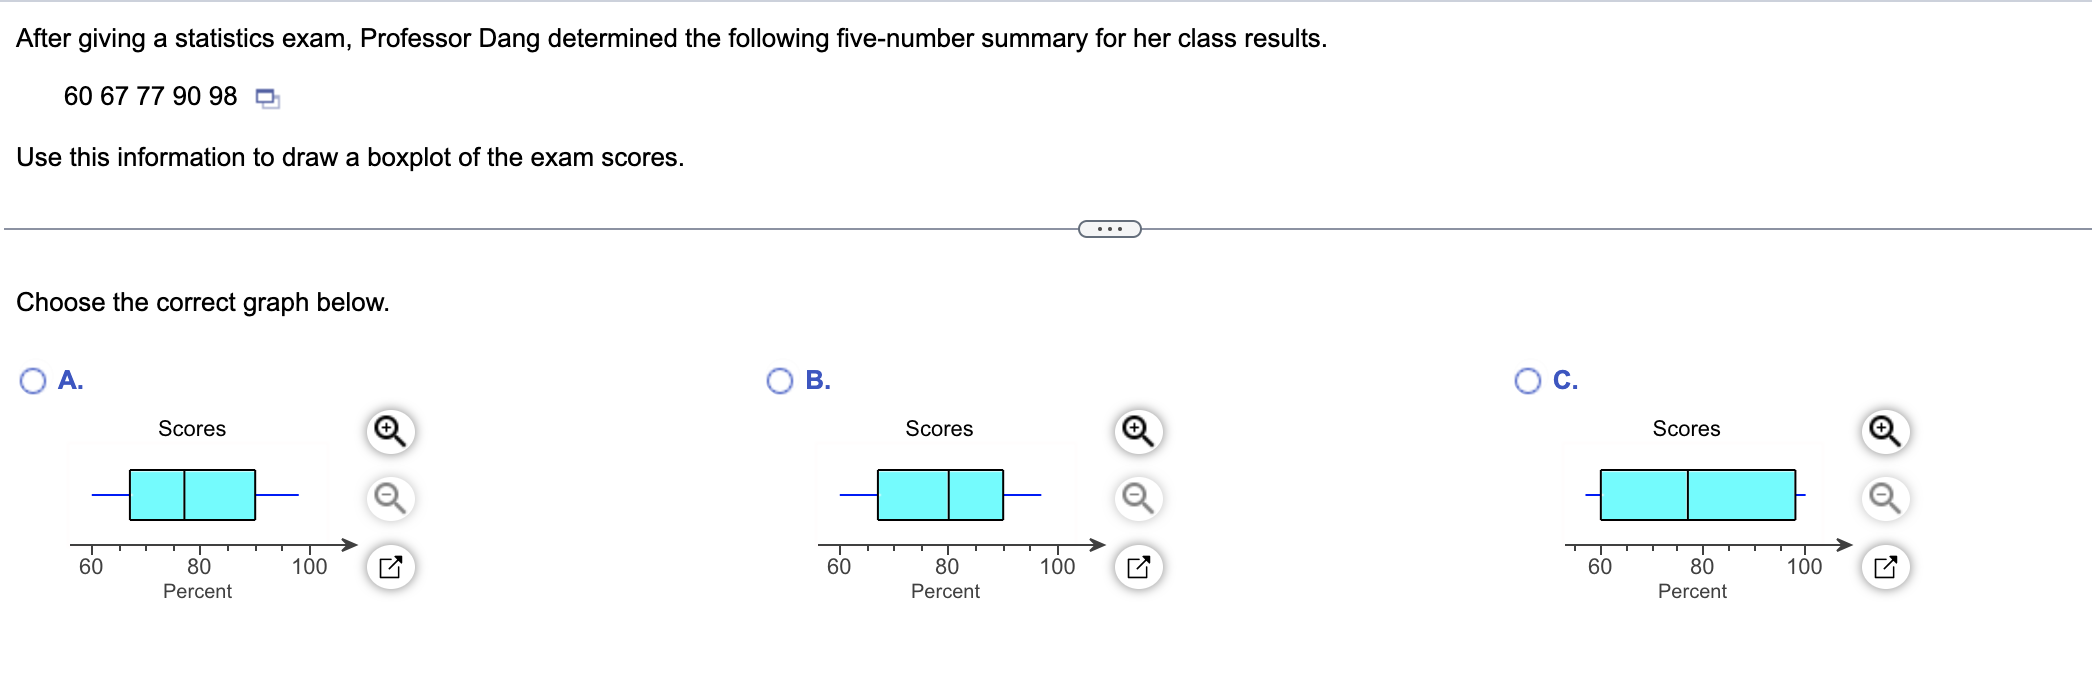
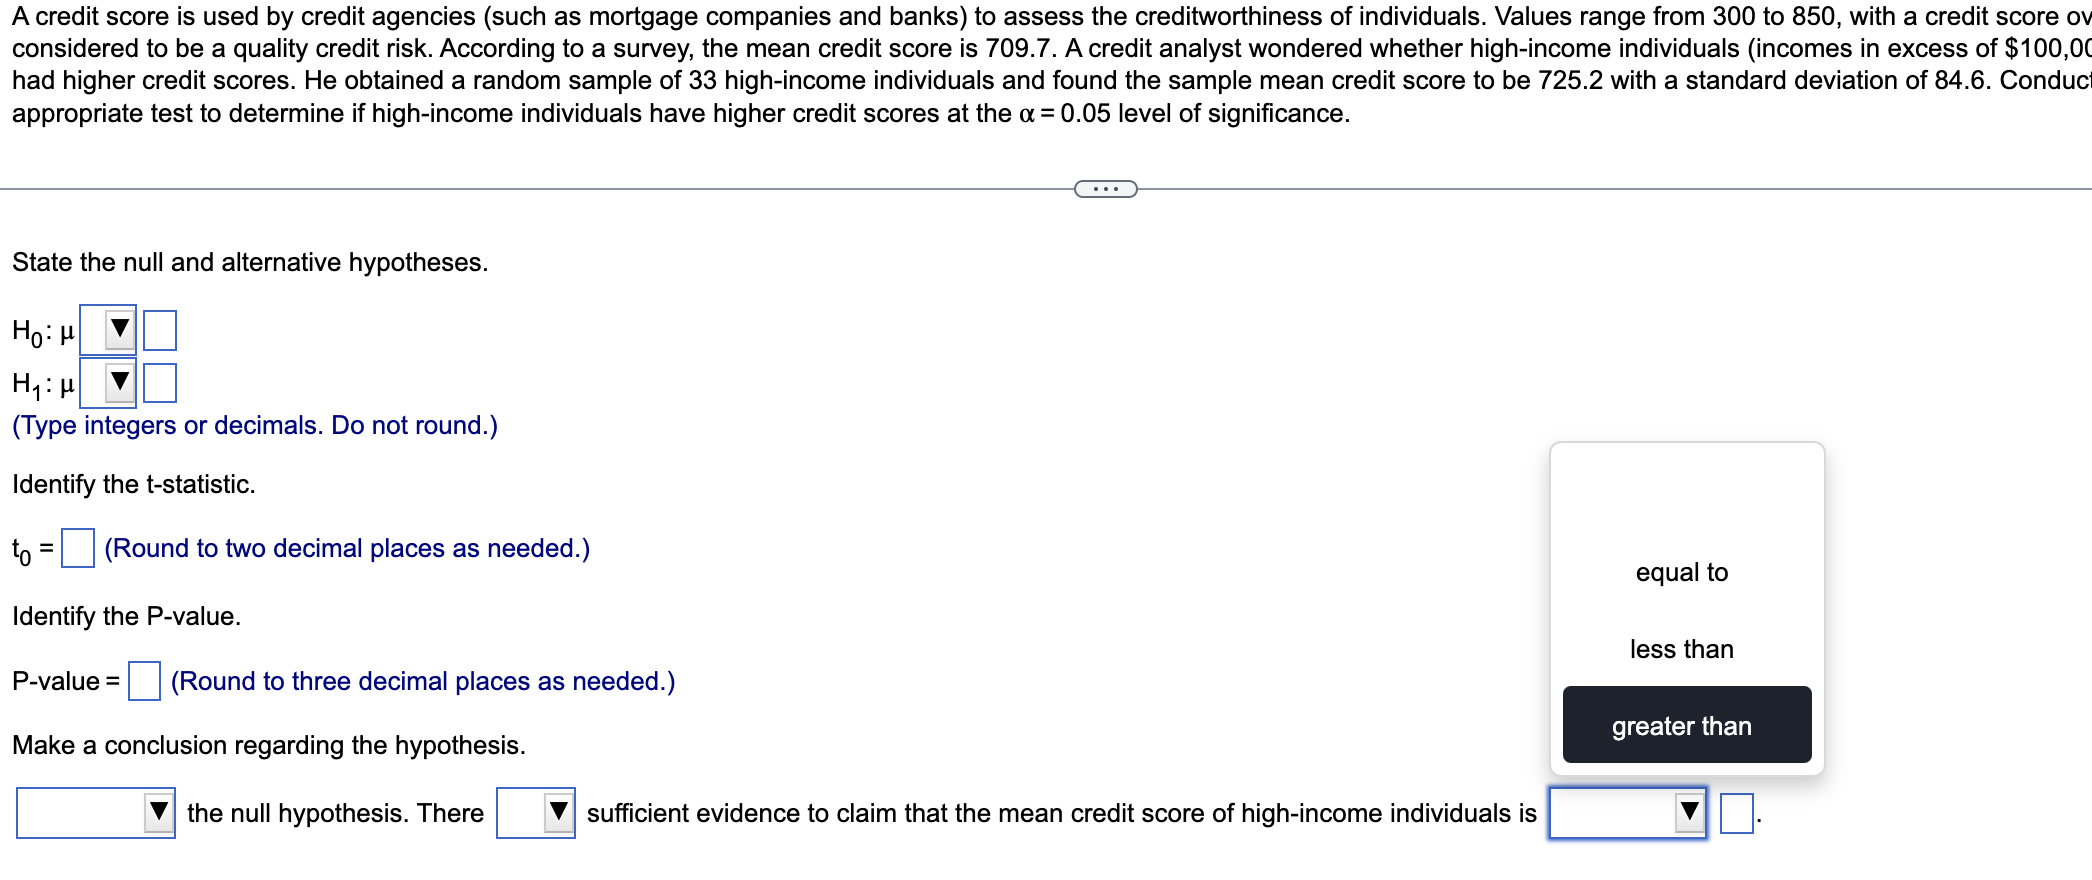
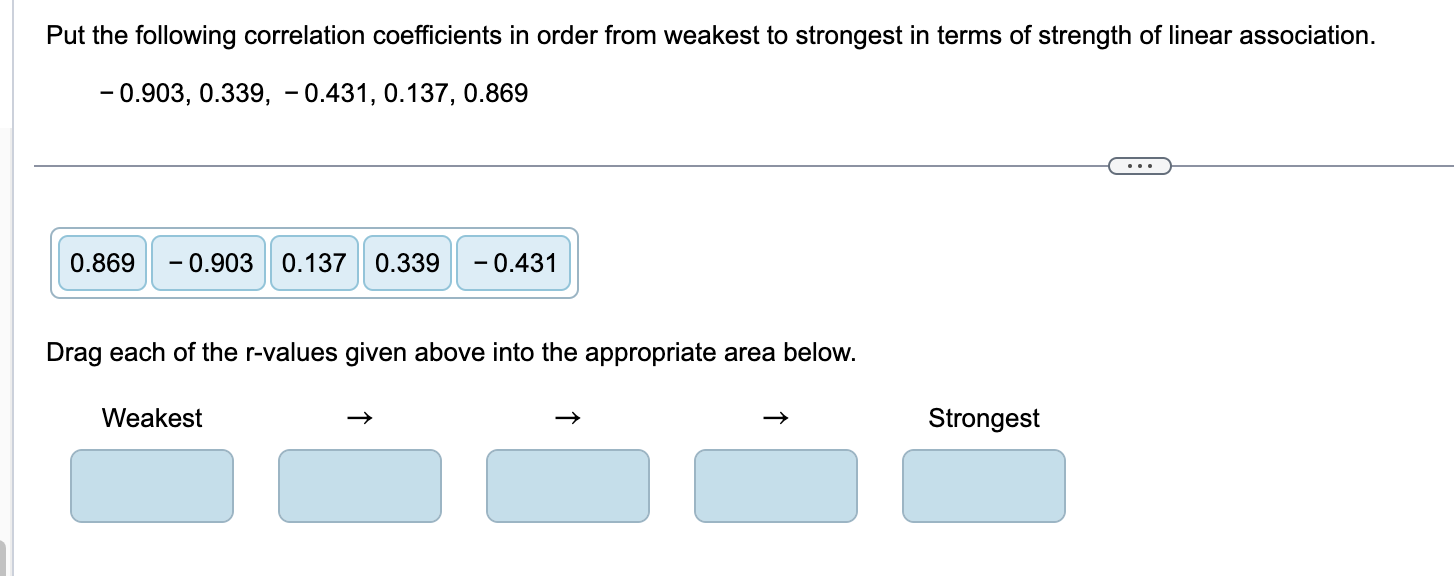
A simple random sample of size n = 15 is drawn from a population that is normally distributed. The sample mean is found to be x = 27.4 and the sample standard deviation is found to be s = 6.3. Determine if the population mean is different from 25 at the a = 0.01 level of significance. Complete parts (a) through (d) below. . . (a) Determine the null and alternative hypotheses. Ho 25 25 (b) Calculate the P-value. P-value = (Round to three decimal places as needed.) (c) State the conclusion for the test. O A. Reject Ho because the P-value is greater than the a = 0.01 level of significance. O B. Do not reject Ho because the P-value is less than the a = 0.01 level of significance. O C. Do not reject Ho because the P-value is greater than the a = 0.01 level of significance. O D. Reject Ho because the P-value is less than the a = 0.01 level of significance. (d) State the conclusion in context of the problem. There sufficient evidence at the a = 0.01 level of significance to conclude that the population mean is different from 25.The probability that a randomly selected 5-year-old male salamander will live to be 6 years old is 0.96341. (a) What is the probability that two randomly selected 5-year-old male salamanders will live to be 6 years old? (b) What is the probability that nine randomly selected 5-year-old male salamanders will live to be 6 years old? (c) What is the probability that at least one of nine randomly selected 5-year-old male salamanders will not live to be 6 years old? Would it be unusual if at least one of nine randomly selected 5-year-old male salamanders did not live to be 6 years old? (a) The probability that two randomly selected 5-year-old male salamanders will live to be 6 years old is (Round to five decimal places as needed.) (b) The probability that nine randomly selected 5-year-old male salamanders will live to be 6 years old is |:| (Round to five decimal places as needed.) (c) The probability that at least one of nine randomly selected 5-year-old male salamanders will not live to be 6 years old is (Round to five decimal places as needed.) Would it be unusual if at least one of nine randomly selected 5-year-old male salamanders did not live to be 6 years old? V| because the probability of this happening is :I 0.05. less than equal to greater than Fill in the blank. The represents the number of standard deviations an observation is from the mean. The EI represents the number of standard deviations an observation is from the mean. z-score range percentile quartile The graph of a normal curve is given. Use the graph to identify the value of p and . & -7 -4 A 2 5 8 1M1 14 17 The value of p is D The value of is |:| Scores of an 1Q test have a bell-shaped distribution with a mean of 100 and a standard deviation of 10. Use the empirical rule to determine the following. (a) What percentage of people has an 1Q score between 90 and 1107 (b) What percentage of people has an 1Q score less than 90 or greater than 110? (c) What percentage of people has an 1Q score greater than 1307 (a) D% (Type an integer or a decimal.) (b) |:|% (Type an integer or a decimal.) (c) D% (Type an integer or a decimal.) A man is planning for college and takes a standardized test. While registering for the test, he is allowed to select four schools to which his scores will be sent at no cost. If there are 12 colleges he is considering, how many different ways could he fill out the score report form? He could fill out the score report form in different ways. Match the linear correlation coefficient to the scatter diagram. The scales on the x- and y-axes are the same for each diagram. (a) r=0.038 (b) r=-0.969 (c) r=0.546 (d)r=1 M Click the icon to view the scatter diagrams. r=-0.969 r=0.546 r=0.038 r=1 Drag each of the r-values given above into the appropriate area below. Response Response Response Explanatory Explanatory Explanatory Response oL & Explanatory Construct a 95% confidence interval of the population proportion using the given information. x=125, n=250 5 Click here to view the table of critical values. Table of critical values The lower bound is D The upper bound is [ |. Level of Confidence, Area in Each Tail, = Critical Value, zs (Round to three decimal places as (1 = a)-100% 2 3 90% 0.05 1645 95% 0.025 196 9% 0.005 2575 G G The figures to the right represent the number of bakeries in two towns. E] Warm Springs - 10 Denton - 7 (a) How are the figures misleading? It looks like Warm Springs has significantly more bakeries than Denton. It looks like bakeries in Warm Springs are much larger than those in Denton. The figures are not misleading. 0w It looks like Warm Springs has slightly fewer bakeries than Denton. (b) What could be done to improve the graphic? The Warm Springs figure should be 5% smaller than it is now. The graph does not need to be changed. The Denton figure should be 10% smaller than the Warm Springs figure. oo wp The Denton figure should be 70% as large as the Warm Springs figure. After giving a statistics exam, Professor Dang determined the following five-number summary for her class results. 60 67 77 90 98 Use this information to draw a boxplot of the exam scores. Choose the correct graph below. O A. O B. O C. Scores Scores Scores 60 80 100 60 80 100 60 80 100 Percent Percent PercentA credit score is used by credit agencies (such as mortgage companies and banks) to assess the creditworthiness of individuals. Values range from 300 to 850, with a credit score ov considered to be a quality credit risk. According to a survey, the mean credit score is 709.7. A credit analyst wondered whether high-income individuals (incomes in excess of $100,0( had higher credit scores. He obtained a random sample of 33 high-income individuals and found the sample mean credit score to be 725.2 with a standard deviation of 84.6. Conduc! appropriate test to determine if high-income individuals have higher credit scores at the o= 0.05 level of significance. =) State the null and alternative hypotheses. i Hyip 1 (Type integers or decimals. Do not round.) Identify the t-statistic. o= (Round to two decimal places as needed.) equal to Identify the P-value. less than P-value = (Round to three decimal places as needed.) 1A Make a conclusion regarding the hypothesis. V| the null hypothesis. There V| sufficient evidence to claim that the mean credit score of high-income individuals is \\:' D Put the following correlation coefficients in order from weakest to strongest in terms of strength of linear association. -0.903, 0.339, -0.431, 0.137, 0.869 0.869 | 0.903 0.137 | 0.339 -0.431 Drag each of the r-values given above into the appropriate area below. Weakest - - - Strongest Fill in the blank. If E and F are not disjoint events, then P(E or F) = If E and F are not disjoint events, then P(E or F) = |:| P(E) + P(F) - P(E and F). P(E) + P(F). P(E and F) - P(E) - P(F). P(E) + P(F) + P(E and F)
Step by Step Solution
There are 3 Steps involved in it
Step: 1
Get Instant Access to Expert-Tailored Solutions
See step-by-step solutions with expert insights and AI powered tools for academic success
Step: 2
Step: 3
Ace Your Homework with AI
Get the answers you need in no time with our AI-driven, step-by-step assistance