Answered step by step
Verified Expert Solution
Question
1 Approved Answer
I need program, plot, and explanation of the plot Objective: The objective of this programming assignment is to design and implement in Java the Merge-Sort

I need program, plot, and explanation of the plot
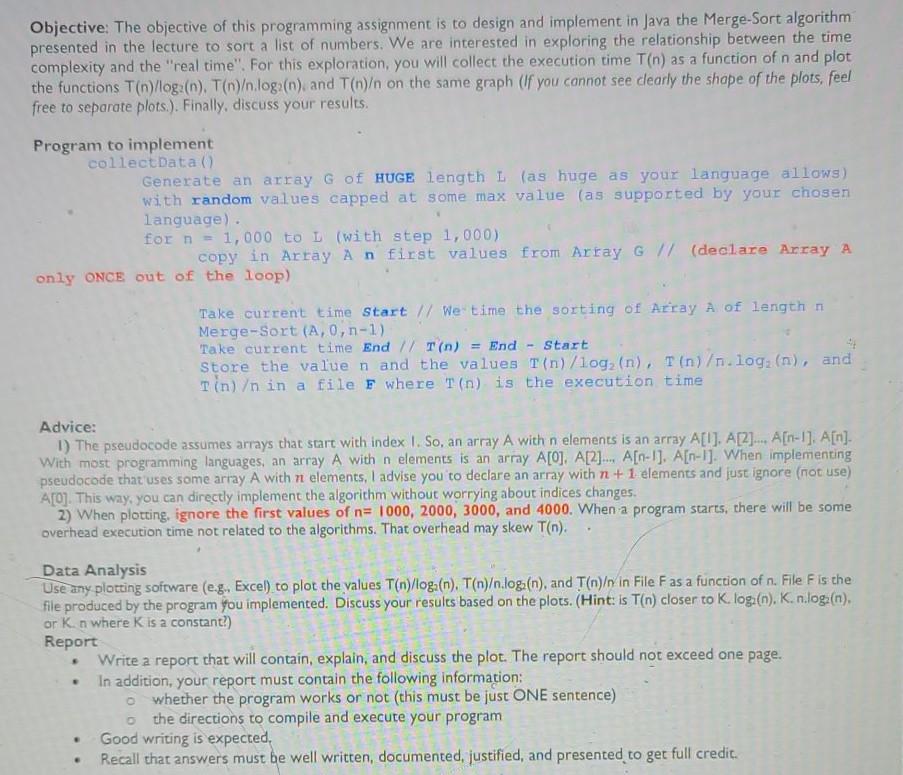
Objective: The objective of this programming assignment is to design and implement in Java the Merge-Sort algorithm presented in the lecture to sort a list of numbers. We are interested in exploring the relationship between the time complexity and the "real time". For this exploration, you will collect the execution time T(n) as a function of n and plot the functions T(n)/log: (n). T(n).log(n), and T(n) on the same graph (If you cannot see dearly the shape of the plots, feel free to separate plots.). Finally, discuss your results. Program to implement collectData() Generate an array G of HUGE length 1 (as huge as your language allows) with random values capped at some max value (as supported by your chosen language). for n = 1,000 to L (with step 1,000) copy in Array A n first values from Array G // (declare Array A only ONCE out of the loop) Take current time Start // We time the sorting of Array A of length n Merge-Sort (A, 0, n-1) Take current time End // T(n) = End - Start 4 Store the value n and the values T(n)/10gz(n), T(n).log(n), and Tin) in a file F where T(n) is the execution time Advice: 1) The pseudocode assumes arrays that start with index 1. So, an array A with n elements is an array A[!]. A[2].... A[n]. A[n]. With most programming languages, an array A with n elements is an array A[0]. A[2]... A[n-I]. A[n-I]. When implementing pseudocode that uses some array A with n elements, I advise you to declare an array with n + 1 elements and just ignore (not use) A[O]. This way, you can directly implement the algorithm without worrying about indices changes. 2) When plotting, ignore the first values of n= 1000, 2000, 3000, and 4000. When a program starts, there will be some overhead execution time not related to the algorithms. That overhead may skew T(m). Data Analysis Use any plotting software (e.g. Excel) to plot the values T(n)/oga(n), T(n).log(n), and T(n) in File Fas a function of n. File Fis the file produced by the program you implemented. Discuss your results based on the plots. (Hint: is T(n) closer to K.log:(), K.n.log(n). or K. n where K is a constant?) Report Write a report that will contain, explain, and discuss the plot. The report should not exceed one page. In addition, your report must contain the following information: whether the program works or not (this must be just ONE sentence) o the directions to compile and execute your program Good writing is expected, Recall that answers must be well written documented, justified, and presented to get full creditStep by Step Solution
There are 3 Steps involved in it
Step: 1

Get Instant Access to Expert-Tailored Solutions
See step-by-step solutions with expert insights and AI powered tools for academic success
Step: 2

Step: 3

Ace Your Homework with AI
Get the answers you need in no time with our AI-driven, step-by-step assistance
Get Started


