

Answered step by step
Verified Expert Solution
Question
1 Approved Answer
I need report for tomorrow, but i couldn't analyze. We're Andrews and this is round 4. Selected Financial Statistics Andrews 6.8% 1.39 9.4% Baldwin 5.7%
I need report for tomorrow, but i couldn't analyze. We're Andrews and this is round 4.
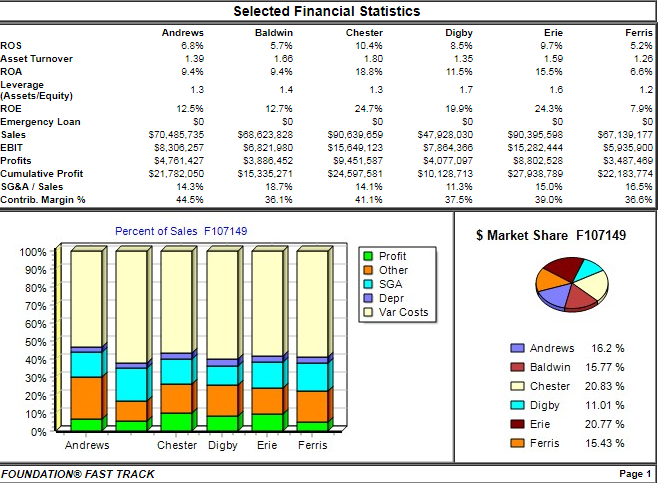
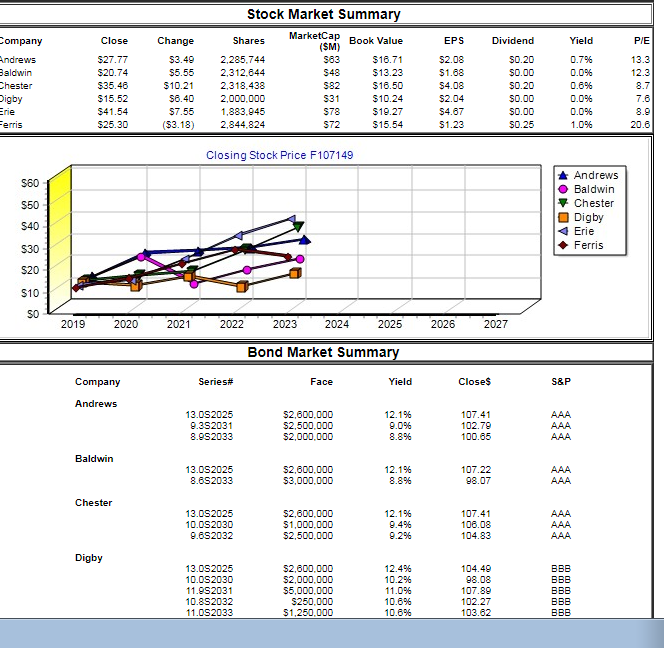
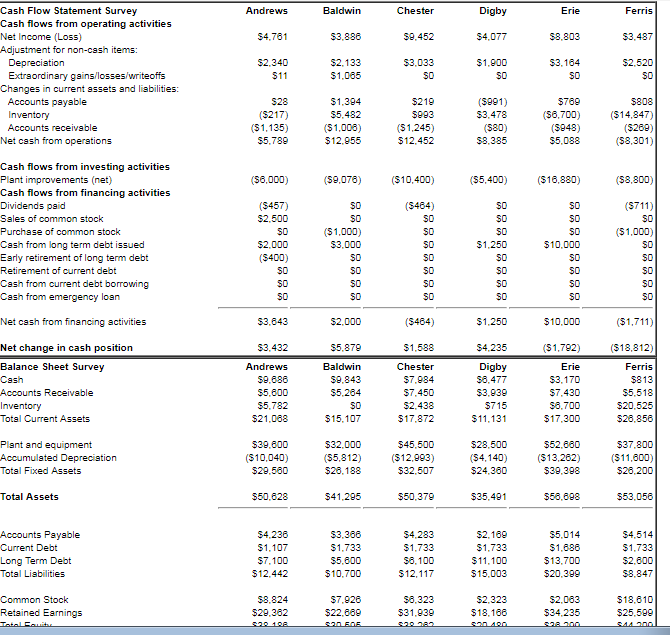
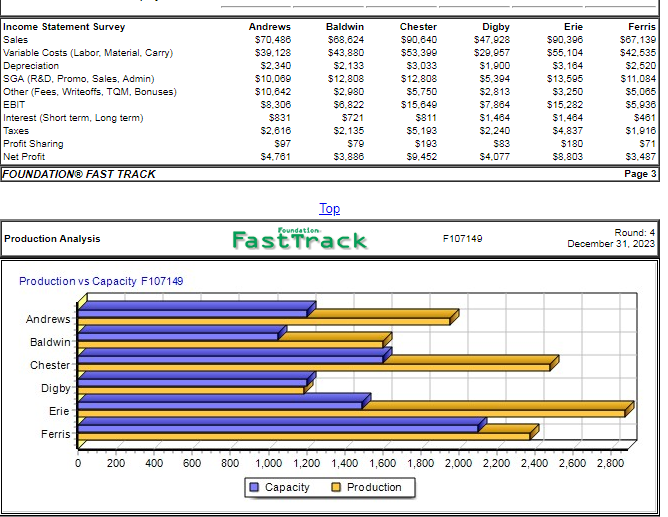
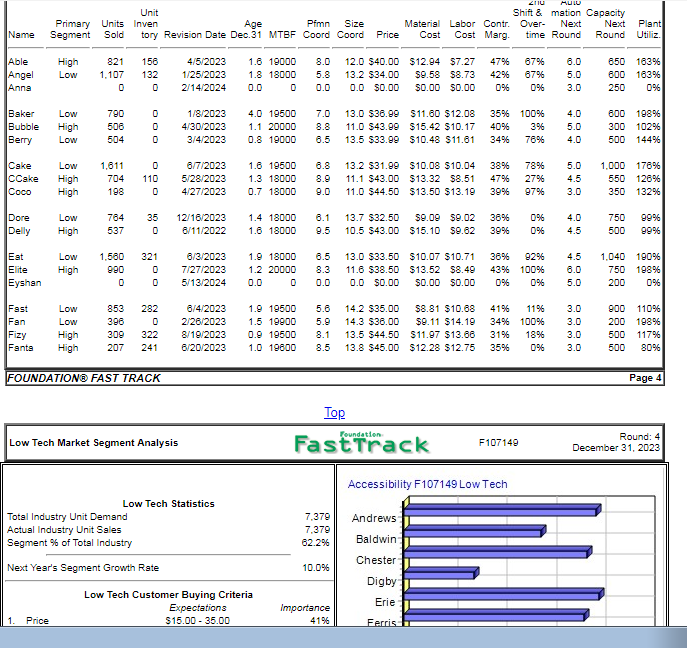

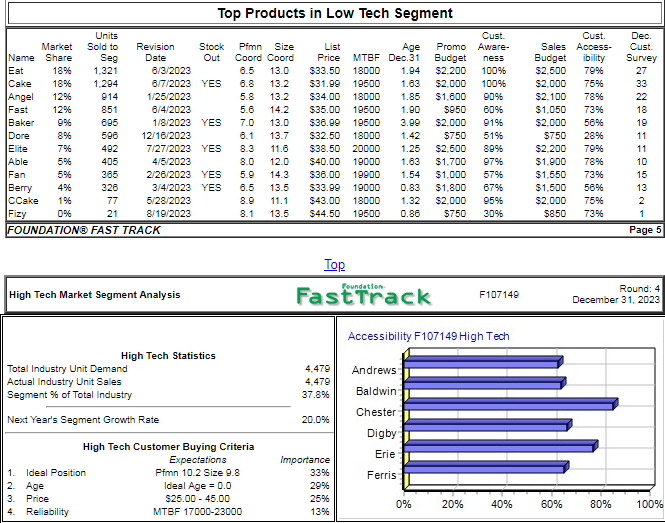
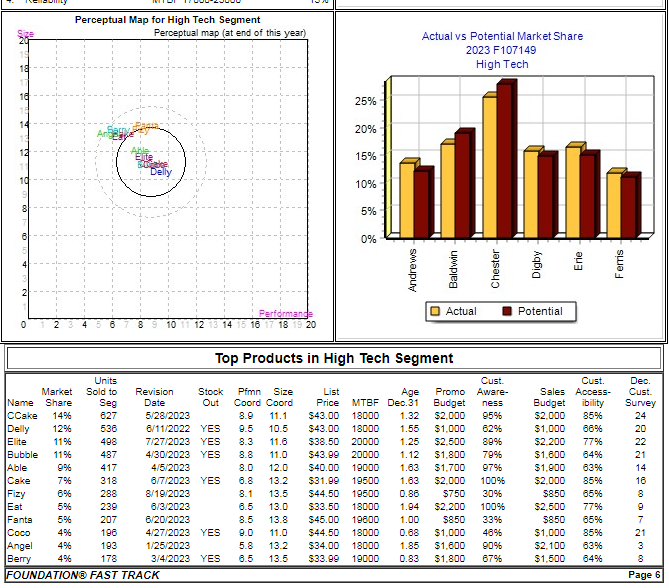
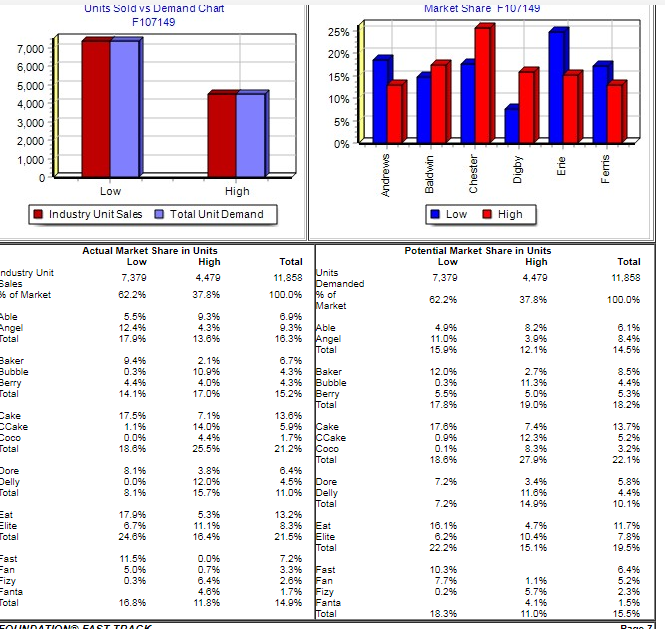
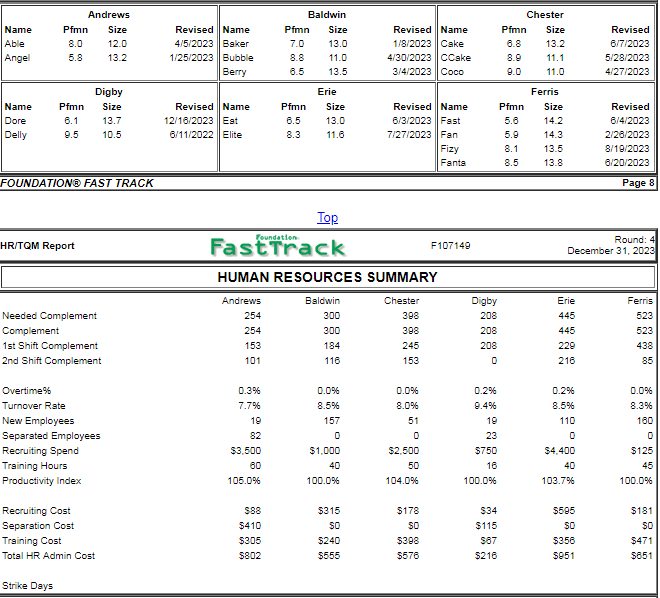
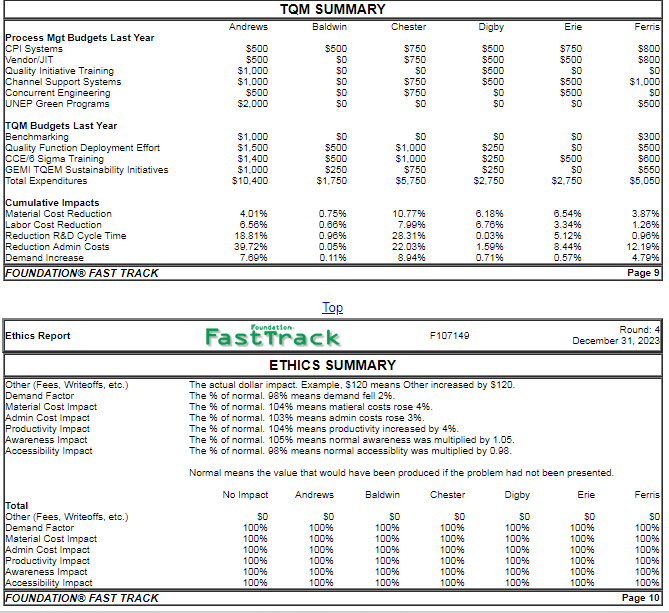
Selected Financial Statistics Andrews 6.8% 1.39 9.4% Baldwin 5.7% 1.68 9.4% Chester 10.4% 1.80 18.8% Digby 8.5% 1.35 11 .5% ROS Asset Turnover ROA Leverage (Assets/Equity) ROE Emergency Loan Sales EBIT Profits Cumulative Profit SG&A / Sales Contrib. Margin % 9.7% 1.59 15.5% 5.2% 1.26 6.6% 12.5% 50 $70,485,735 58,308,257 54,761.427 21,782.050 14.3% 44.5% 12.7% 50 588,623.828 58,821.980 53,888.452 15,335.271 18.7% 36.1% 24.7% 50 590,639.659 15,649.123 59,451.537 524,597,581 14.1% 41.1% 19.9% 50 47,928,030 57,884,388 54,077,007 $10,128,713 11 .3% 37.5% 24.3% 50 S90,395.593 15,282.444 58,802,528 $27,938.789 15.0% 39.0% 7.9% 50 $7,13.177 55,935,900 53.487.489 $22,183.774 18.5% 36.6% Percent of Sales F107149 $ Market Share F107149 100% Profit Other SGA Depr Var Costs 90% 60% ] Andrews 16.2% -Baldwin 15.77% Chester 20.83% -Digby 11.01% 20.77 % ] Ferris 15.43 % 30% 10% 1% Erie Andrews Chester Digby Erie Ferris FOUNDATIONE FAST TRAC Page 1 Stock Market Summary Maktap Book Value MarketCa Change EPS $27.77 20.74 S35.48 $15.52 $41.54 53.49 2,285,744 55.55 2,312.844 $10.2 2,318,438 2,000,000 1,833.945 2,844,824 50.20 50.00 50.20 50.00 50.00 50.25 0.7% 0.0% 52.08 eldwin 543 82 $13.23 $16.50 $10.24 $19.27 54.08 52.04 54.67 56.40 57.55 53.18) S78 372 1.0% Closing Stock Price F107149 Andrews Baldwin Chester S60 S40 S30 S20 Ferris S0 2020 2021 2022 2023 2024 2025 2026 2027 Bond Market Summa Company Series# Face Yield CloseS S&P Andrews 13.0S2025 9.3S2031 8.952033 52,600,000 52,500,000 52,000,000 12.1% 9.0% 8.8% 107.41 102.79 100.65 13.0S2025 8.852033 52,600,000 53,000,000 107.22 98.07 8.8% Chester 13.0S2025 10.0S2030 9.652032 52,600,000 51,000,000 52,500,000 12.1% 9.4% 9.296 107.41 108.03 104.83 Digby 13.0S2025 10.0S2030 11.952031 10.852032 11.052033 52,600,000 52,000,000 55,000,000 250,000 51.250,000 104.49 10.2% 11.0% 10.6% 10.6% 107.89 102.27 103.82 Baldwin $3,888 $2.133 Chester Cash Flow Statement Survey Cash flows from operating activities Net Income (Loss) Adjustment for non-cssh items Andrews Di $8,803 Depreciation Extraordinary gains/losses/writeoffs 50 50 50 Changes in current assets and liabilities: $1.394 S5.482 Accounts payable ($14,847) ($1,135) (51,245) $12.4D $12,955 $5,088 (58,301 Cash flows from investing activities Plant improvements (net) Cash flows from financing activities Dividends psid Sales of common stock Purchase of common stock Cssh from long term debt issued Early retirement of long term debt Retirement of current debt Cash from current debt borrowing Cssh from emergency losn 50 50 50 50 50 Net cash from financing activities Net change in cash position Balance Sheet Survey Accounts Receivable Total Current Assets $3,843 $10,000 (518,812) $5.879 Baldwin S9.843 $5.284 $4.235 Chester 5715 $11,131 520.525 528,858 $17,111) 552.680 s39,398 $121,111 $15.107 Plant and equipment Accumulsted Depreciation Total Fixed Assets ($10,040) 528.188 532,507 524.360 Total Assets 541,295 S50,379 553,058 Accounts Payable $4,283 1.1 512,442 S8,824 Long Term Debt Total Liabilities $11.10) $12,117 520,309 S8,847 $18,610 $25,599 Common Stock $7.928 $22,869 529.382 1R.1 534.235 Income Statement Survey Sales Variable Costs (Labor, Material, Carry) Depreciation SGA (R&D, Promo, Sales, Admin) Other (Fees, Writeoffs, TOM, Bonuses) EBIT Interest (Short term, Long term) Taxes Profit Sharing Net Profit Andrews 570.488 539.128 $2.340 510,089 510,842 $8.306 5831 $2,616 S97 $4.761 Baldwin 568.824 543.880 S2.133 12,808 $2,980 3,822 5721 $2.135 S79 3.888 Chester 590,840 553.399 S3.033 12,808 5.750 $15,649 $811 $5.193 5193 S9.452 Digby $47.928 529,957 $1,900 $5,394 $2,813 $7,884 $1.484 2,240 590,396 555,104 S3.184 13,595 S3.250 515,282 $1.484 $4,837 5180 $8.803 567.139 542,535 $2,520 11.084 $5.065 $5,936 5481 $1,916 571 $3.487 4,077 OUNDATIONE FAST TRACK Page 3 ation FastTrack Round: 4 December 31, 2023 Production Analysis F107149 Production vs Capacity F107149 Andrews Baldwin Chester Digby Ferris 0 200 400 600 800 1,000 1,200 1,400 1,600 1,800 2,000 2,200 2,400 2,600 2,800 Capacity Production Unit Primary Units Inven Shift & mation Capacity Material Labor Contr. Over Next Next Plant Name Segment Sold tory Revision Date Dec.31 MTBF Coord Coord Price Cost Cost Marg. time Round Round Utiliz Pfmn Size Able 4/5/2023 1.619000 8.0 12.0 $40.00 $12.94 $7.27 47% 67% 6.0 650 163% Angel Low 1.107 132 1/25/2023 1.818000 5.8 13.2 S34.00 S9.53$8.73 42% 67% 5.0 600 163% 0 0.0 0.0 SO.OO SO.00 S0.00 0% 0% 3.0 250 0% High 821 158 0 2114/20240.0 Baker Low Bubble High 1/8/2023 4.019500 7.0 13.0$36.99$11.60$12.08 35% 100% 4.0 000 198% 300 10296 Berry Low 504 0 3/4/2023 0.819000 6.5 13.5 $33.99 $10.48 $11.81 34% 76% 4.0 500 144% 790 4/30/2023 1.120000 8.8 11.0 $43.99 $15.42 $10.17 40% 3% 5.0 6/7/2023 1.619500 6.8 13.2 $31.99 $10.08 $10.04 38% 78% 5.0 1.000 176% 550 126% 0 4/27/2023 0.718000 9.0 11.0 $44.50 $13.50 $13.19 39% 97% 3.0 350 132% Low 1,611 CCake High Coco High 704 110 5/28/2023 1.318000 8.9 11.1 $43.00 $13.32 $8.51 47% 27% 4.5 198 Dore Delly Eat 784 35 12/16/2023 1.418000 6.1 13.7 $32.50 S9.09S9.02 36% 0% 4.0 750 9996 500 9996 High 537 o 6/11/2022 1.618000 9.5 10.5 $43.00 $15. 10$9.82 39% 0% 4.5 Low 1,50 321 High 6/3/2023 1.918000 6.5 13.0 $33.50 $10.07 $10.71 36% 92% 4.5 1.040 190% 0 7/27/2023 1.220000 8.3 11.6$38.50 $13.52 S8.49 43% 100% 6.0 750 198% 0 0.0 0.0 SO.OO SO.00 S0.00 0% 0% 5.0 200 0% Eyshan 0 513/20240.0 282 322 Fast Fan 853 396 309 207 2/26/2023 8/1g:2023 e20:2023 6/4/2023 1.919500 5.6 14.2 $35.00 $8.81 $10.88 41% 11% 3.0 3.0 3.0 3.0 1.519900 0.919500 1.019000 5.9 8.1 8.5 14.3 S36.00 13.5 $44.50$11.97 $13.86 13.8 $45.00 $12.28 $12.75 900 110% 200 198% 500 117% 500 80% $9. 1 1 $14.19 zy Fants 34% 31% 35% 100% 18% 0% High 241 OUNDATIONE FAST TRACK Page 4 FastTrack 10714 December 51. 202 ndation Round: 4 Low Tech Market Segment Analysis Accessibility F107149 Low Tech Low Tech Statistics Total Industry Unit Demand Actual Industry Unit Sales Segment % of Total Industry 7.379 Andrews 7.379 62.29611 Baldwin Chester Next Years Segment Growth Rate 10.0% Low Tech Customer Buying Criteria Erie Expectations 1 Price $15.00 35.00 41% Top Products in Low Tech Segment Market Sold to Revision Stock Pfmn Size /3/2023 1/25/2023 Age Promo Aware- Sales Access Cust. bility Survey Name Share Eat Cake 18% 1.294 Angel 12% Fast Baker Seg 1896 1.321 Date Out Coord Coord Price MTBF Dec.31 Budget ness 6.5 13.0 $33.50 18000 1.94 $2.200 100% 6/7/2023 YES 6.8 13.2 $31.99 19500 1.63 $2,000 100% 5.8 13.2 534.00 18000 85 $1.600 9096 5.6 14.2 $35.00 19500 1.90 $950 60% 1/8/2023 YES 7.0 13.0 $36.99 19500 3.99 $2,000 91% 6.1 13.7 $32.50 18000 1.42 $750 51% 7/27/2023 YES 8.3 11.6 $38.50 20000 1.25 $2,500 89% 8.0 12.0 $40.00 19000 1.63 $1.700 97% 2/26/2023 YES 5.9 14.3 $36.00 19900 1.54 $1,000 57% 3/4/2023 YES 6.5 13.5 $33.99 19000 0.83 $1.800 67% 8.9 11.1 $43.00 18000 1.32 $2,000 95% .1 13.5 $44.50 19500 0.86 $750 30% Budget $2.500 $2,000 $2.100 $1,050 $2,000 $750 $2.200 $1.900 $1.550 $1,500 $2,000 $850 7g% 75% 78% 73% 56% 28% 7g% 78% 73% 56% 75% 73% 914 851 12% 8/4/2023 896 12/16/2023 492 405 365 Able Fan Berry 4% CCake 1% Fizy 596 596 13 5/28/2023 19/2023 OUNDATIONE FAST TRACK Page 5 ation FastTrack 07146 Round: 4 December 31, 2023 High Tech Market Segment Analysis Accessibility F107149 High Tech High Tech Statistics Total Industry Unit Demand Actual Industry Unit Sales Segment % of Total Industry 4.479Andrews 4.479 37.896 Baldwin Chester Next Years Segment Growth Rate 20.0% Digby High Tech Customer Buying Criteria Erie 1 Idesl Position 2. Age 3. Price 4. Reliability Expectations Pfmn 10.2 Size 9.8 Ideal Age 0.0 S25.00 45.00 MTBF 17000-23000 33% 29% 25% 13% Ferris 1% 20% 40% 60% 80% 100% Top Products in Low Tech Segment Market Sold to Revision Stock Pfmn Size /3/2023 1/25/2023 Age Promo Aware- Sales Access Cust. bility Survey Name Share Eat Cake 18% 1.294 Angel 12% Fast Baker Seg 1896 1.321 Date Out Coord Coord Price MTBF Dec.31 Budget ness 6.5 13.0 $33.50 18000 1.94 $2.200 100% 6/7/2023 YES 6.8 13.2 $31.99 19500 1.63 $2,000 100% 5.8 13.2 534.00 18000 85 $1.600 9096 5.6 14.2 $35.00 19500 1.90 $950 60% 1/8/2023 YES 7.0 13.0 $36.99 19500 3.99 $2,000 91% 6.1 13.7 $32.50 18000 1.42 $750 51% 7/27/2023 YES 8.3 11.6 $38.50 20000 1.25 $2,500 89% 8.0 12.0 $40.00 19000 1.63 $1.700 97% 2/26/2023 YES 5.9 14.3 $36.00 19900 1.54 $1,000 57% 3/4/2023 YES 6.5 13.5 $33.99 19000 0.83 $1.800 67% 8.9 11.1 $43.00 18000 1.32 $2,000 95% .1 13.5 $44.50 19500 0.86 $750 30% Budget $2.500 $2,000 $2.100 $1,050 $2,000 $750 $2.200 $1.900 $1.550 $1,500 $2,000 $850 7g% 75% 78% 73% 56% 28% 7g% 78% 73% 56% 75% 73% 914 851 12% 8/4/2023 896 12/16/2023 492 405 365 Able Fan Berry 4% CCake 1% Fizy 596 596 13 5/28/2023 19/2023 OUNDATIONE FAST TRACK Page 5 ation FastTrack 07146 Round: 4 December 31, 2023 High Tech Market Segment Analysis Accessibility F107149 High Tech High Tech Statistics Total Industry Unit Demand Actual Industry Unit Sales Segment % of Total Industry 4.479Andrews 4.479 37.896 Baldwin Chester Next Years Segment Growth Rate 20.0% Digby High Tech Customer Buying Criteria Erie 1 Idesl Position 2. Age 3. Price 4. Reliability Expectations Pfmn 10.2 Size 9.8 Ideal Age 0.0 S25.00 45.00 MTBF 17000-23000 33% 29% 25% 13% Ferris 1% 20% 40% 60% 80% 100% Perceptual Map for High Tech Segment Perceptual map fat end of this Actual vs Potential Market Share 2023 F107149 High Tech Actual Potential 2 3 4 5 6 7 89 10 11 12 13 14 15 18 17 18 19 20 Top Products in High Tech Segment Cust Cust Dec. Market Sold to Revision Stock Pfmn Size Out Coord Coord Price MTBF Dec.31 Budget ness 8.9 11.1 $43.00 18000 1.32 $2,000 95% 6/11/2022 YES 9.5 10.5 $43.00 18000 1.55 $1,000 62% 7/27/2023 YES 8.3 11.6 $38.50 20000 1.25 $2,500 89% 4/30/2023 YES 8.8 11.0 $43.99 20000 1.12 $1.800 79% 8.0 12.0 $40.00 19000 1.63 $1.700 97% 6/7/2023 YES 6.8 13.2 $31.99 19500 1.63 $2.000 100% .1 13.5 $44.50 19500 0.86 $750 30% 6.5 13.0 $33.50 18000 1.94 $2.200 100% 8.5 13.8 $45.00 19 00 1.00 $850 33% 196 4/27/2023 YES 9.0 11.0 $44.50 18000 0.88 $1,000 46% 5.8 13.2 534.00 18000 85 $1.600 9096 3/4/2023 YES 6.5 13.5 $33.99 19000 0.83 $1.800 67% Survey 1/25/2023 OUNDATIONE FAST TRACK Page 6 Units Sold vs Demand Chart F107149 Market Share F10/149 7,000 6,000 5,000 4,000 3,000 2,000 1,000 20% 15% 10% 1% Industry Unit Sales Total Unit Demand Low High Actual Market Share in Units Potential Market Share in Units High Total ndustry Unit a es of Market Total 11,858 100.0% 7,379 11,858 Units 7,379 62.2% 37.8% 100.0% of 62.2% 37.8% 6.9% 9.3% 12.4% 17.9% 4.3% 13.6% be 4.9% 11.0% 15.9% 8.2% 3.9% 12.1% 18.3% Angel 8.4% aker ubble 6.796 43% er 4.3% obe 0.3% 4.4% 14.1% 10.9% 4.0% 17.0% 12.0% 0.3% 5.5% 17.8% 2.7% 11.3% 5.0% 19.0% 4.4% 5.3% 18.2% 15.2% 17.5% 13.6% 14.0% 5.9% Cake 1.7% Cake 17.6% 0.9% 13.7% 5.2% 0.0% 18.6% 12.3% 21.2% Coco 18.6% 7.2% 7.2% 27.9% 45% pore 11.0% Delly 0.0% 12.0% 15.7% 11.8% 14.9% 4.4% at ite 17.9% 6.7% 24.6% 13.2% 8.3% 16.1% 6.296 22.2% 4.7% 10.4% 18.4% ite 19.5% 11.5% 5.0% 0.3% 0.0% 0.7% 6.4% 4.896 7.2% 10.3% 0.2% 18.3% 2.6% 1.7% 5.2% anta Fy 18.8% 14.9% Fanta 11.0% Baldwin Chester Pfmn Size .8 13.2 Name Pfmn Size Pfmn Size 8.0 12.0 5.8 13.2 Revised Name 4/5/2023 Baker 1/25 2023 Bubble Revised Name 1/8/2023 Cake 4/30/2023 CCake 34 2023 Coco Revised 6/7/2023 5/28/2023 4/27/2023 Digby Pfmn Size Ferns Name Revised Name Pfmn Size Revised Name Pfmn Size 5. 14.2 8.1 13.5 Revised 6/4/2023 2/28/2023 8/19/2023 /20/2023 12/16/2023 Est 6/11/2022 Elite 6.5 13.0 6/3/2023 Fast 7/27/2023 Fan Fizy Delly 5 10.5 Fanta 13.8 FOUNDATION FAST TRACH Page 8 FastTrack Round: December 31, 202 HRTQM Report F107149 HUMAN RESOURCES SUMMARY Baldwin Digby Ferns 393 Needed Complement Complement 1st Shift Complement 2nd Shift Complement 300 445 445 523 153 184 118 153 Overtime% Turnover Rate New Employees Separated Employees Recruiting Spend Training Hours Productivity Index 0.2% 0.3% 7.7% 0.0% 8.5% 157 0.0% 8.0% 0.0% 8.3% 160 8.5% 82 $3,500 $1,000 $2,500 5750 $4,400 S125 105.0% 100.0% 104.0% 100.0% 103.7% 100.0% Recruiting Cost Separation Cost Training Cost Total HR Admin Cost 533 5410 5305 5315 50 5240 $178 50 5398 5595 50 5356 5951 5181 50 5471 5851 S87 5218 Strike Days TQM SUMMARY Andrews Baldwin Chester Digby Ferns Process Mgt Budgets Last Year 5500 5500 5500 5500 5500 PI 5750 5750 5500 5500 50 Initiative Training 50 50 50 50 hannel Support Systems nt Engineering UNEP Green Programs 50 50 5500 QM Budgets Last Year uality Function Deployment Effort EMI TOEM Sustainability Initiatives erking neployment 5300 5500 $1.000 5500 5500 5250 5250 5250 5250 50 5500 CCE/S Sigma Training 510,400 $5.050 umulative Impacts Material Cost Reduction 4,01% 6.56% 18.81% 39.72% 7.80% 0.75% 0.86% 0.95% 0.05% 10.77% 7.99% 28.31% 22.03% 8.94% 8.186 6.76% 0.03% 1.596 6.54% 3.34% 5.126 8.44% 3.87% 1.26% r Cost Reduction Reduction R&D Cycle Time Reduction Admin Costs 12.19% and Increase OUNDATIONE FAST TRACK Round thics Report FastTrack F107149 ETHICS SUMMARY (Fees, Writeoffs, etc.) nd Factor Material Cost Impact dmin Cost Impact roductivity Impact The actusl dollar impact. Example, 5120 means Other increased by S120 The % of normal, 98% means demand fell 2% The % of normal. 104% means materal costs rose 4% The % of normal. 103% means admin costs rose 3%. The % of normal. 104% means productivity increased by 4% The % of normal. 105% means normal awareness was multiplied by 1.05 The % of normal, 98% means normal accessiblity was multiplied by 0.98 ibility Normal means the value that would have been produced if the problem had not been presented. No ImpactAndrews Ferns etc.) 50 100% 100% 100% 100% 100% 100% 100% 100% 100% 100% 100% nd Factor Material Cost Impact dmin Cost Impact roductivity Impact 100% 100% 100% 100% 100% 100% 100% 100% 100% 100% 100% 100% 100% 100% 100% 100% 100% 100% 100% 100% 100% 100% 100% 100% 100% 100% 100% ccessibility Impsct OUNDATIONE FAST TRACK Selected Financial Statistics Andrews 6.8% 1.39 9.4% Baldwin 5.7% 1.68 9.4% Chester 10.4% 1.80 18.8% Digby 8.5% 1.35 11 .5% ROS Asset Turnover ROA Leverage (Assets/Equity) ROE Emergency Loan Sales EBIT Profits Cumulative Profit SG&A / Sales Contrib. Margin % 9.7% 1.59 15.5% 5.2% 1.26 6.6% 12.5% 50 $70,485,735 58,308,257 54,761.427 21,782.050 14.3% 44.5% 12.7% 50 588,623.828 58,821.980 53,888.452 15,335.271 18.7% 36.1% 24.7% 50 590,639.659 15,649.123 59,451.537 524,597,581 14.1% 41.1% 19.9% 50 47,928,030 57,884,388 54,077,007 $10,128,713 11 .3% 37.5% 24.3% 50 S90,395.593 15,282.444 58,802,528 $27,938.789 15.0% 39.0% 7.9% 50 $7,13.177 55,935,900 53.487.489 $22,183.774 18.5% 36.6% Percent of Sales F107149 $ Market Share F107149 100% Profit Other SGA Depr Var Costs 90% 60% ] Andrews 16.2% -Baldwin 15.77% Chester 20.83% -Digby 11.01% 20.77 % ] Ferris 15.43 % 30% 10% 1% Erie Andrews Chester Digby Erie Ferris FOUNDATIONE FAST TRAC Page 1 Stock Market Summary Maktap Book Value MarketCa Change EPS $27.77 20.74 S35.48 $15.52 $41.54 53.49 2,285,744 55.55 2,312.844 $10.2 2,318,438 2,000,000 1,833.945 2,844,824 50.20 50.00 50.20 50.00 50.00 50.25 0.7% 0.0% 52.08 eldwin 543 82 $13.23 $16.50 $10.24 $19.27 54.08 52.04 54.67 56.40 57.55 53.18) S78 372 1.0% Closing Stock Price F107149 Andrews Baldwin Chester S60 S40 S30 S20 Ferris S0 2020 2021 2022 2023 2024 2025 2026 2027 Bond Market Summa Company Series# Face Yield CloseS S&P Andrews 13.0S2025 9.3S2031 8.952033 52,600,000 52,500,000 52,000,000 12.1% 9.0% 8.8% 107.41 102.79 100.65 13.0S2025 8.852033 52,600,000 53,000,000 107.22 98.07 8.8% Chester 13.0S2025 10.0S2030 9.652032 52,600,000 51,000,000 52,500,000 12.1% 9.4% 9.296 107.41 108.03 104.83 Digby 13.0S2025 10.0S2030 11.952031 10.852032 11.052033 52,600,000 52,000,000 55,000,000 250,000 51.250,000 104.49 10.2% 11.0% 10.6% 10.6% 107.89 102.27 103.82 Baldwin $3,888 $2.133 Chester Cash Flow Statement Survey Cash flows from operating activities Net Income (Loss) Adjustment for non-cssh items Andrews Di $8,803 Depreciation Extraordinary gains/losses/writeoffs 50 50 50 Changes in current assets and liabilities: $1.394 S5.482 Accounts payable ($14,847) ($1,135) (51,245) $12.4D $12,955 $5,088 (58,301 Cash flows from investing activities Plant improvements (net) Cash flows from financing activities Dividends psid Sales of common stock Purchase of common stock Cssh from long term debt issued Early retirement of long term debt Retirement of current debt Cash from current debt borrowing Cssh from emergency losn 50 50 50 50 50 Net cash from financing activities Net change in cash position Balance Sheet Survey Accounts Receivable Total Current Assets $3,843 $10,000 (518,812) $5.879 Baldwin S9.843 $5.284 $4.235 Chester 5715 $11,131 520.525 528,858 $17,111) 552.680 s39,398 $121,111 $15.107 Plant and equipment Accumulsted Depreciation Total Fixed Assets ($10,040) 528.188 532,507 524.360 Total Assets 541,295 S50,379 553,058 Accounts Payable $4,283 1.1 512,442 S8,824 Long Term Debt Total Liabilities $11.10) $12,117 520,309 S8,847 $18,610 $25,599 Common Stock $7.928 $22,869 529.382 1R.1 534.235 Income Statement Survey Sales Variable Costs (Labor, Material, Carry) Depreciation SGA (R&D, Promo, Sales, Admin) Other (Fees, Writeoffs, TOM, Bonuses) EBIT Interest (Short term, Long term) Taxes Profit Sharing Net Profit Andrews 570.488 539.128 $2.340 510,089 510,842 $8.306 5831 $2,616 S97 $4.761 Baldwin 568.824 543.880 S2.133 12,808 $2,980 3,822 5721 $2.135 S79 3.888 Chester 590,840 553.399 S3.033 12,808 5.750 $15,649 $811 $5.193 5193 S9.452 Digby $47.928 529,957 $1,900 $5,394 $2,813 $7,884 $1.484 2,240 590,396 555,104 S3.184 13,595 S3.250 515,282 $1.484 $4,837 5180 $8.803 567.139 542,535 $2,520 11.084 $5.065 $5,936 5481 $1,916 571 $3.487 4,077 OUNDATIONE FAST TRACK Page 3 ation FastTrack Round: 4 December 31, 2023 Production Analysis F107149 Production vs Capacity F107149 Andrews Baldwin Chester Digby Ferris 0 200 400 600 800 1,000 1,200 1,400 1,600 1,800 2,000 2,200 2,400 2,600 2,800 Capacity Production Unit Primary Units Inven Shift & mation Capacity Material Labor Contr. Over Next Next Plant Name Segment Sold tory Revision Date Dec.31 MTBF Coord Coord Price Cost Cost Marg. time Round Round Utiliz Pfmn Size Able 4/5/2023 1.619000 8.0 12.0 $40.00 $12.94 $7.27 47% 67% 6.0 650 163% Angel Low 1.107 132 1/25/2023 1.818000 5.8 13.2 S34.00 S9.53$8.73 42% 67% 5.0 600 163% 0 0.0 0.0 SO.OO SO.00 S0.00 0% 0% 3.0 250 0% High 821 158 0 2114/20240.0 Baker Low Bubble High 1/8/2023 4.019500 7.0 13.0$36.99$11.60$12.08 35% 100% 4.0 000 198% 300 10296 Berry Low 504 0 3/4/2023 0.819000 6.5 13.5 $33.99 $10.48 $11.81 34% 76% 4.0 500 144% 790 4/30/2023 1.120000 8.8 11.0 $43.99 $15.42 $10.17 40% 3% 5.0 6/7/2023 1.619500 6.8 13.2 $31.99 $10.08 $10.04 38% 78% 5.0 1.000 176% 550 126% 0 4/27/2023 0.718000 9.0 11.0 $44.50 $13.50 $13.19 39% 97% 3.0 350 132% Low 1,611 CCake High Coco High 704 110 5/28/2023 1.318000 8.9 11.1 $43.00 $13.32 $8.51 47% 27% 4.5 198 Dore Delly Eat 784 35 12/16/2023 1.418000 6.1 13.7 $32.50 S9.09S9.02 36% 0% 4.0 750 9996 500 9996 High 537 o 6/11/2022 1.618000 9.5 10.5 $43.00 $15. 10$9.82 39% 0% 4.5 Low 1,50 321 High 6/3/2023 1.918000 6.5 13.0 $33.50 $10.07 $10.71 36% 92% 4.5 1.040 190% 0 7/27/2023 1.220000 8.3 11.6$38.50 $13.52 S8.49 43% 100% 6.0 750 198% 0 0.0 0.0 SO.OO SO.00 S0.00 0% 0% 5.0 200 0% Eyshan 0 513/20240.0 282 322 Fast Fan 853 396 309 207 2/26/2023 8/1g:2023 e20:2023 6/4/2023 1.919500 5.6 14.2 $35.00 $8.81 $10.88 41% 11% 3.0 3.0 3.0 3.0 1.519900 0.919500 1.019000 5.9 8.1 8.5 14.3 S36.00 13.5 $44.50$11.97 $13.86 13.8 $45.00 $12.28 $12.75 900 110% 200 198% 500 117% 500 80% $9. 1 1 $14.19 zy Fants 34% 31% 35% 100% 18% 0% High 241 OUNDATIONE FAST TRACK Page 4 FastTrack 10714 December 51. 202 ndation Round: 4 Low Tech Market Segment Analysis Accessibility F107149 Low Tech Low Tech Statistics Total Industry Unit Demand Actual Industry Unit Sales Segment % of Total Industry 7.379 Andrews 7.379 62.29611 Baldwin Chester Next Years Segment Growth Rate 10.0% Low Tech Customer Buying Criteria Erie Expectations 1 Price $15.00 35.00 41% Top Products in Low Tech Segment Market Sold to Revision Stock Pfmn Size /3/2023 1/25/2023 Age Promo Aware- Sales Access Cust. bility Survey Name Share Eat Cake 18% 1.294 Angel 12% Fast Baker Seg 1896 1.321 Date Out Coord Coord Price MTBF Dec.31 Budget ness 6.5 13.0 $33.50 18000 1.94 $2.200 100% 6/7/2023 YES 6.8 13.2 $31.99 19500 1.63 $2,000 100% 5.8 13.2 534.00 18000 85 $1.600 9096 5.6 14.2 $35.00 19500 1.90 $950 60% 1/8/2023 YES 7.0 13.0 $36.99 19500 3.99 $2,000 91% 6.1 13.7 $32.50 18000 1.42 $750 51% 7/27/2023 YES 8.3 11.6 $38.50 20000 1.25 $2,500 89% 8.0 12.0 $40.00 19000 1.63 $1.700 97% 2/26/2023 YES 5.9 14.3 $36.00 19900 1.54 $1,000 57% 3/4/2023 YES 6.5 13.5 $33.99 19000 0.83 $1.800 67% 8.9 11.1 $43.00 18000 1.32 $2,000 95% .1 13.5 $44.50 19500 0.86 $750 30% Budget $2.500 $2,000 $2.100 $1,050 $2,000 $750 $2.200 $1.900 $1.550 $1,500 $2,000 $850 7g% 75% 78% 73% 56% 28% 7g% 78% 73% 56% 75% 73% 914 851 12% 8/4/2023 896 12/16/2023 492 405 365 Able Fan Berry 4% CCake 1% Fizy 596 596 13 5/28/2023 19/2023 OUNDATIONE FAST TRACK Page 5 ation FastTrack 07146 Round: 4 December 31, 2023 High Tech Market Segment Analysis Accessibility F107149 High Tech High Tech Statistics Total Industry Unit Demand Actual Industry Unit Sales Segment % of Total Industry 4.479Andrews 4.479 37.896 Baldwin Chester Next Years Segment Growth Rate 20.0% Digby High Tech Customer Buying Criteria Erie 1 Idesl Position 2. Age 3. Price 4. Reliability Expectations Pfmn 10.2 Size 9.8 Ideal Age 0.0 S25.00 45.00 MTBF 17000-23000 33% 29% 25% 13% Ferris 1% 20% 40% 60% 80% 100% Top Products in Low Tech Segment Market Sold to Revision Stock Pfmn Size /3/2023 1/25/2023 Age Promo Aware- Sales Access Cust. bility Survey Name Share Eat Cake 18% 1.294 Angel 12% Fast Baker Seg 1896 1.321 Date Out Coord Coord Price MTBF Dec.31 Budget ness 6.5 13.0 $33.50 18000 1.94 $2.200 100% 6/7/2023 YES 6.8 13.2 $31.99 19500 1.63 $2,000 100% 5.8 13.2 534.00 18000 85 $1.600 9096 5.6 14.2 $35.00 19500 1.90 $950 60% 1/8/2023 YES 7.0 13.0 $36.99 19500 3.99 $2,000 91% 6.1 13.7 $32.50 18000 1.42 $750 51% 7/27/2023 YES 8.3 11.6 $38.50 20000 1.25 $2,500 89% 8.0 12.0 $40.00 19000 1.63 $1.700 97% 2/26/2023 YES 5.9 14.3 $36.00 19900 1.54 $1,000 57% 3/4/2023 YES 6.5 13.5 $33.99 19000 0.83 $1.800 67% 8.9 11.1 $43.00 18000 1.32 $2,000 95% .1 13.5 $44.50 19500 0.86 $750 30% Budget $2.500 $2,000 $2.100 $1,050 $2,000 $750 $2.200 $1.900 $1.550 $1,500 $2,000 $850 7g% 75% 78% 73% 56% 28% 7g% 78% 73% 56% 75% 73% 914 851 12% 8/4/2023 896 12/16/2023 492 405 365 Able Fan Berry 4% CCake 1% Fizy 596 596 13 5/28/2023 19/2023 OUNDATIONE FAST TRACK Page 5 ation FastTrack 07146 Round: 4 December 31, 2023 High Tech Market Segment Analysis Accessibility F107149 High Tech High Tech Statistics Total Industry Unit Demand Actual Industry Unit Sales Segment % of Total Industry 4.479Andrews 4.479 37.896 Baldwin Chester Next Years Segment Growth Rate 20.0% Digby High Tech Customer Buying Criteria Erie 1 Idesl Position 2. Age 3. Price 4. Reliability Expectations Pfmn 10.2 Size 9.8 Ideal Age 0.0 S25.00 45.00 MTBF 17000-23000 33% 29% 25% 13% Ferris 1% 20% 40% 60% 80% 100% Perceptual Map for High Tech Segment Perceptual map fat end of this Actual vs Potential Market Share 2023 F107149 High Tech Actual Potential 2 3 4 5 6 7 89 10 11 12 13 14 15 18 17 18 19 20 Top Products in High Tech Segment Cust Cust Dec. Market Sold to Revision Stock Pfmn Size Out Coord Coord Price MTBF Dec.31 Budget ness 8.9 11.1 $43.00 18000 1.32 $2,000 95% 6/11/2022 YES 9.5 10.5 $43.00 18000 1.55 $1,000 62% 7/27/2023 YES 8.3 11.6 $38.50 20000 1.25 $2,500 89% 4/30/2023 YES 8.8 11.0 $43.99 20000 1.12 $1.800 79% 8.0 12.0 $40.00 19000 1.63 $1.700 97% 6/7/2023 YES 6.8 13.2 $31.99 19500 1.63 $2.000 100% .1 13.5 $44.50 19500 0.86 $750 30% 6.5 13.0 $33.50 18000 1.94 $2.200 100% 8.5 13.8 $45.00 19 00 1.00 $850 33% 196 4/27/2023 YES 9.0 11.0 $44.50 18000 0.88 $1,000 46% 5.8 13.2 534.00 18000 85 $1.600 9096 3/4/2023 YES 6.5 13.5 $33.99 19000 0.83 $1.800 67% Survey 1/25/2023 OUNDATIONE FAST TRACK Page 6 Units Sold vs Demand Chart F107149 Market Share F10/149 7,000 6,000 5,000 4,000 3,000 2,000 1,000 20% 15% 10% 1% Industry Unit Sales Total Unit Demand Low High Actual Market Share in Units Potential Market Share in Units High Total ndustry Unit a es of Market Total 11,858 100.0% 7,379 11,858 Units 7,379 62.2% 37.8% 100.0% of 62.2% 37.8% 6.9% 9.3% 12.4% 17.9% 4.3% 13.6% be 4.9% 11.0% 15.9% 8.2% 3.9% 12.1% 18.3% Angel 8.4% aker ubble 6.796 43% er 4.3% obe 0.3% 4.4% 14.1% 10.9% 4.0% 17.0% 12.0% 0.3% 5.5% 17.8% 2.7% 11.3% 5.0% 19.0% 4.4% 5.3% 18.2% 15.2% 17.5% 13.6% 14.0% 5.9% Cake 1.7% Cake 17.6% 0.9% 13.7% 5.2% 0.0% 18.6% 12.3% 21.2% Coco 18.6% 7.2% 7.2% 27.9% 45% pore 11.0% Delly 0.0% 12.0% 15.7% 11.8% 14.9% 4.4% at ite 17.9% 6.7% 24.6% 13.2% 8.3% 16.1% 6.296 22.2% 4.7% 10.4% 18.4% ite 19.5% 11.5% 5.0% 0.3% 0.0% 0.7% 6.4% 4.896 7.2% 10.3% 0.2% 18.3% 2.6% 1.7% 5.2% anta Fy 18.8% 14.9% Fanta 11.0% Baldwin Chester Pfmn Size .8 13.2 Name Pfmn Size Pfmn Size 8.0 12.0 5.8 13.2 Revised Name 4/5/2023 Baker 1/25 2023 Bubble Revised Name 1/8/2023 Cake 4/30/2023 CCake 34 2023 Coco Revised 6/7/2023 5/28/2023 4/27/2023 Digby Pfmn Size Ferns Name Revised Name Pfmn Size Revised Name Pfmn Size 5. 14.2 8.1 13.5 Revised 6/4/2023 2/28/2023 8/19/2023 /20/2023 12/16/2023 Est 6/11/2022 Elite 6.5 13.0 6/3/2023 Fast 7/27/2023 Fan Fizy Delly 5 10.5 Fanta 13.8 FOUNDATION FAST TRACH Page 8 FastTrack Round: December 31, 202 HRTQM Report F107149 HUMAN RESOURCES SUMMARY Baldwin Digby Ferns 393 Needed Complement Complement 1st Shift Complement 2nd Shift Complement 300 445 445 523 153 184 118 153 Overtime% Turnover Rate New Employees Separated Employees Recruiting Spend Training Hours Productivity Index 0.2% 0.3% 7.7% 0.0% 8.5% 157 0.0% 8.0% 0.0% 8.3% 160 8.5% 82 $3,500 $1,000 $2,500 5750 $4,400 S125 105.0% 100.0% 104.0% 100.0% 103.7% 100.0% Recruiting Cost Separation Cost Training Cost Total HR Admin Cost 533 5410 5305 5315 50 5240 $178 50 5398 5595 50 5356 5951 5181 50 5471 5851 S87 5218 Strike Days TQM SUMMARY Andrews Baldwin Chester Digby Ferns Process Mgt Budgets Last Year 5500 5500 5500 5500 5500 PI 5750 5750 5500 5500 50 Initiative Training 50 50 50 50 hannel Support Systems nt Engineering UNEP Green Programs 50 50 5500 QM Budgets Last Year uality Function Deployment Effort EMI TOEM Sustainability Initiatives erking neployment 5300 5500 $1.000 5500 5500 5250 5250 5250 5250 50 5500 CCE/S Sigma Training 510,400 $5.050 umulative Impacts Material Cost Reduction 4,01% 6.56% 18.81% 39.72% 7.80% 0.75% 0.86% 0.95% 0.05% 10.77% 7.99% 28.31% 22.03% 8.94% 8.186 6.76% 0.03% 1.596 6.54% 3.34% 5.126 8.44% 3.87% 1.26% r Cost Reduction Reduction R&D Cycle Time Reduction Admin Costs 12.19% and Increase OUNDATIONE FAST TRACK Round thics Report FastTrack F107149 ETHICS SUMMARY (Fees, Writeoffs, etc.) nd Factor Material Cost Impact dmin Cost Impact roductivity Impact The actusl dollar impact. Example, 5120 means Other increased by S120 The % of normal, 98% means demand fell 2% The % of normal. 104% means materal costs rose 4% The % of normal. 103% means admin costs rose 3%. The % of normal. 104% means productivity increased by 4% The % of normal. 105% means normal awareness was multiplied by 1.05 The % of normal, 98% means normal accessiblity was multiplied by 0.98 ibility Normal means the value that would have been produced if the problem had not been presented. No ImpactAndrews Ferns etc.) 50 100% 100% 100% 100% 100% 100% 100% 100% 100% 100% 100% nd Factor Material Cost Impact dmin Cost Impact roductivity Impact 100% 100% 100% 100% 100% 100% 100% 100% 100% 100% 100% 100% 100% 100% 100% 100% 100% 100% 100% 100% 100% 100% 100% 100% 100% 100% 100% ccessibility Impsct OUNDATIONE FAST TRACK
Step by Step Solution
There are 3 Steps involved in it
Step: 1

Get Instant Access to Expert-Tailored Solutions
See step-by-step solutions with expert insights and AI powered tools for academic success
Step: 2

Step: 3
Ace Your Homework with AI
Get the answers you need in no time with our AI-driven, step-by-step assistance
Get Started