 I need the expected NPV std, dev. CV and value option for figures 13.2 - 13.4 Example of what's needed below(13.10:
Part I: Project without the Growth Option:
NPV (Good): You can use row 2 of the calculator with the following inputs:
CF0 = -3000; C01 = 1500; F01 = 3; I = 12; CPT NPV; NPV = $603
Note: If you don't feel comfortable using the frequency key, you can enter the cash flows as follows:
CF0 = -3000; C01 = 1500; F01 = 1; C02 = 1500; F02 = 1; C03 = 1500; F03 =1
You follow the same procedure for the bad outcome and you get NPV = -$358
Expected NPV:
(.5*603) + (.5*(-358)) = $122
Standard Deviation:
SQRT[..5(603-122)^2 + .5(-358-122)^2] = $480
CV:
480/122 = 3.93
Part II: Project with the Option
The calculations are identical to part I. When you follow the calculations noted above, you get the following numbers:
Expected NPV = $1,503
Std. Dev. = $1,861
CV = 1.24
Part III: Value of the Option
Value of the option is the expected NPV with the option - expected NPV without the option. In this case:
Value of the option = $1,503 - $122 = $1,381
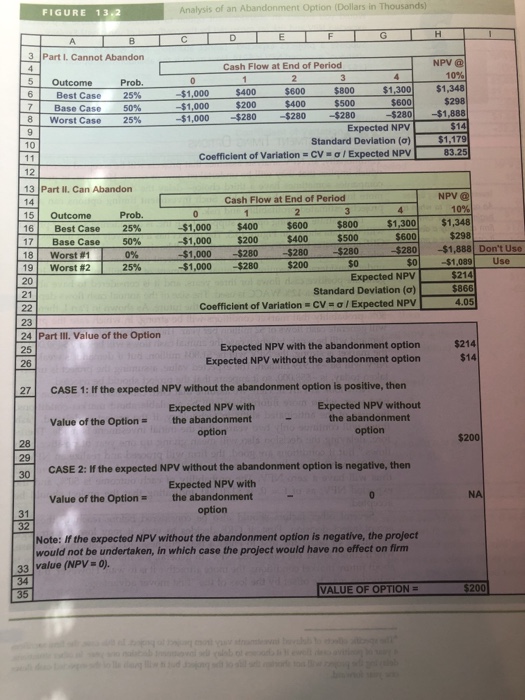
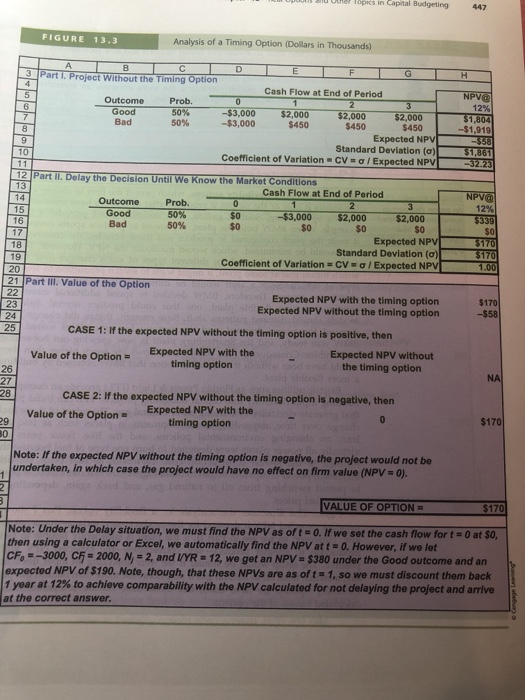
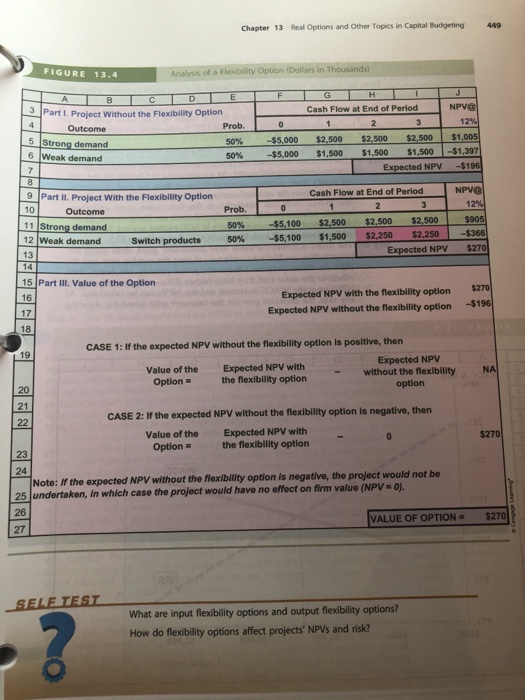
Chapter 13: Go over figures 13.1 to 13.4 in your textbook and be familiar with the following computations: Expected NPV std. dev., CV and value of the option. Notes: 1. I am referring to the figures embedded in the narrative of the chapter and not the end of chapter problems 2 I will post an Announcement showing all the computations for figure 13 1. You may omit that figure, but you need to show the computations for parts I. Il and Ill in figures 132, 13.3 and 13.4 | FIGURE 13.2 Analysis of an Abandonment Option (Dollars in Thousands) 3 Part I. Cannot Abandon NPV @ 10% $1,348 $298 -$280-$1,888 Cash Flow at End of Period 5 Outcome Prob. 25% 50% 25% $400 $200 $800 $500 $1,300 $600 -$1,000 Best Case Base Case Worst Case -$1,000 $400 1,000 $280 $280 -$280 Expected NPV Standard Deviation (a) $1,17 10 83.25 coefficient of variation = CV- , Expected NPV 13 Part II. Can Abandon 14 15 Outcome 16 Best Case 25% 1 Base Case 50% 18 | worst #1 NPV @ 10% $1,348 $298 $280-$1,888 Don't Use So$1,089Use $214 Cash Flow at End of Period Prob. $600 $400 $800 $500 $1,3001 $600 $1,000$400 -$1,000 $1,000-$280-$280-$280 -$1,000-$280 $200 s200 19 Worst #2 25% Expected NPV Standard Deviation (a) Coefficient of Variation-CV- / Expected NPV $866 4.05 23 24 Part III. Value of the Option 25 26 $214 Expected NPV with the abandonment option Expected NPV without the abandonment option $14 27 CASE 1: If the expected NPV without the abandonment option is positive, then Expected NPV without the abandonment Expected NPV with Value of the Option the abandonment option $200 CASE 2: If the expected NPV without the abandonment option is negative, then Expected NPV with Value of the Option the abandonment option 31 32 Note: If the expected NPV without the abandonment option is negative, the project would not be undertaken, in which case the project would have no effect on firm value (NPV-0). s ailu uthal Topics in Capital Budgeting 447 FIGURE 13.3 Analysis of a Timing Option (Dollars in Thousands) 3 Part I. Project Without the Timing Option Cash Flow at End of Period Outcome Prob. O 3,000 12% Bad 50% -$3,000 -$1,919 Expected NPV Standard Deviation (a) NPV Coefficient of Variation-CV / Ex 12 Part We Know the Market Conditions Cash Flow at End of Period 14 15 16 12% Good 50% $2,000 $0 $0 Expected NPV 18 19 Coefficient of Variation / Ex NPV 21 Part II. Value of the Option Expected NPV with the timing option Expected NPV without the timing option 23 CASE 1: If the expected NPV without the timing option is positive, then Expected NPV with the timing option Expected NPV without the timing option Value of the Option- 27 CASE 2: If the expected NPV without the timing option is negative, then Value of the OptionExpected NPV with the timing option Note: If the expected NPV without the timing option is negative, the project would not be undertaken, in which case the project would have no effect on firm value (NPV 0). VALUE OF OPTION 170 Note: Under the Delay situation, we must find the NPV as of t o.If we set the cash flow for t 0 at $0 then using a calculator or Excel, we automatically find the NPV att - 0. However, if we let CFo -3000, c5 2000, N, -2, and UYR 12, we get an NPV $380 under the Good outcome and an expected NPV of $190. Note, though, that these NPVs are as of t 1, so we must discount them back 1 year at 12% to achieve comparability with the NPV calculated for not delaying the project and arrive at the correct answer Chapter 13 Real Options and Other Topics in Capital Budgeting 449 FIGURE 13.4 Analysis of a Flexubility Option (Dollars in Thousands) Cash Flow at End of Period 3 Part I. Project Without the Flexibility Option Outcome Prob. $5,000 $2,500 $2,500 $2,500 $1,005 5 Strong demand 6 Weak demand $5,000 $1,500 $1.500 $1,500-$1.397 Expected NPV -$196 50% Cash Flow at End of Period 9 Part I. Project With the Flexibility Option 10 Prob ssos| $5,100 $1.500 $2.250 $2,250 $366 Expected NPV $270 $2,500 s2.500 s2 5001 -$5.100 50% 50% 12 Weak demand 13 14 Switch products 15 Part III. Value of the Option 16 17 18 Expected NPV with the flexiblity option $270 Expected NPV without the flexibility option -$196 CASE 1: If the expected NPV without the flexibility option is positive, then 19 Expected NPV Value of the Expected NPV with Optionthe flexibility option - without the flexibilityNA 20 CASE 2: f the expected NPV without the flexibility option is negative, then Expected NPV with the flexibility option 21 Value of the Option 24 Note: If the expected NPV without the flexiblity option is negative, the project would not be 25 undertaken, in which case the project would have no effect on firm value (NPV o VALUE OF OPTION$270 What are input flexibility options and output flexibility options? How do flexibility options affect projects' NPVs and risk? Chapter 13: Go over figures 13.1 to 13.4 in your textbook and be familiar with the following computations: Expected NPV std. dev., CV and value of the option. Notes: 1. I am referring to the figures embedded in the narrative of the chapter and not the end of chapter problems 2 I will post an Announcement showing all the computations for figure 13 1. You may omit that figure, but you need to show the computations for parts I. Il and Ill in figures 132, 13.3 and 13.4 | FIGURE 13.2 Analysis of an Abandonment Option (Dollars in Thousands) 3 Part I. Cannot Abandon NPV @ 10% $1,348 $298 -$280-$1,888 Cash Flow at End of Period 5 Outcome Prob. 25% 50% 25% $400 $200 $800 $500 $1,300 $600 -$1,000 Best Case Base Case Worst Case -$1,000 $400 1,000 $280 $280 -$280 Expected NPV Standard Deviation (a) $1,17 10 83.25 coefficient of variation = CV- , Expected NPV 13 Part II. Can Abandon 14 15 Outcome 16 Best Case 25% 1 Base Case 50% 18 | worst #1 NPV @ 10% $1,348 $298 $280-$1,888 Don't Use So$1,089Use $214 Cash Flow at End of Period Prob. $600 $400 $800 $500 $1,3001 $600 $1,000$400 -$1,000 $1,000-$280-$280-$280 -$1,000-$280 $200 s200 19 Worst #2 25% Expected NPV Standard Deviation (a) Coefficient of Variation-CV- / Expected NPV $866 4.05 23 24 Part III. Value of the Option 25 26 $214 Expected NPV with the abandonment option Expected NPV without the abandonment option $14 27 CASE 1: If the expected NPV without the abandonment option is positive, then Expected NPV without the abandonment Expected NPV with Value of the Option the abandonment option $200 CASE 2: If the expected NPV without the abandonment option is negative, then Expected NPV with Value of the Option the abandonment option 31 32 Note: If the expected NPV without the abandonment option is negative, the project would not be undertaken, in which case the project would have no effect on firm value (NPV-0). s ailu uthal Topics in Capital Budgeting 447 FIGURE 13.3 Analysis of a Timing Option (Dollars in Thousands) 3 Part I. Project Without the Timing Option Cash Flow at End of Period Outcome Prob. O 3,000 12% Bad 50% -$3,000 -$1,919 Expected NPV Standard Deviation (a) NPV Coefficient of Variation-CV / Ex 12 Part We Know the Market Conditions Cash Flow at End of Period 14 15 16 12% Good 50% $2,000 $0 $0 Expected NPV 18 19 Coefficient of Variation / Ex NPV 21 Part II. Value of the Option Expected NPV with the timing option Expected NPV without the timing option 23 CASE 1: If the expected NPV without the timing option is positive, then Expected NPV with the timing option Expected NPV without the timing option Value of the Option- 27 CASE 2: If the expected NPV without the timing option is negative, then Value of the OptionExpected NPV with the timing option Note: If the expected NPV without the timing option is negative, the project would not be undertaken, in which case the project would have no effect on firm value (NPV 0). VALUE OF OPTION 170 Note: Under the Delay situation, we must find the NPV as of t o.If we set the cash flow for t 0 at $0 then using a calculator or Excel, we automatically find the NPV att - 0. However, if we let CFo -3000, c5 2000, N, -2, and UYR 12, we get an NPV $380 under the Good outcome and an expected NPV of $190. Note, though, that these NPVs are as of t 1, so we must discount them back 1 year at 12% to achieve comparability with the NPV calculated for not delaying the project and arrive at the correct answer Chapter 13 Real Options and Other Topics in Capital Budgeting 449 FIGURE 13.4 Analysis of a Flexubility Option (Dollars in Thousands) Cash Flow at End of Period 3 Part I. Project Without the Flexibility Option Outcome Prob. $5,000 $2,500 $2,500 $2,500 $1,005 5 Strong demand 6 Weak demand $5,000 $1,500 $1.500 $1,500-$1.397 Expected NPV -$196 50% Cash Flow at End of Period 9 Part I. Project With the Flexibility Option 10 Prob ssos| $5,100 $1.500 $2.250 $2,250 $366 Expected NPV $270 $2,500 s2.500 s2 5001 -$5.100 50% 50% 12 Weak demand 13 14 Switch products 15 Part III. Value of the Option 16 17 18 Expected NPV with the flexiblity option $270 Expected NPV without the flexibility option -$196 CASE 1: If the expected NPV without the flexibility option is positive, then 19 Expected NPV Value of the Expected NPV with Optionthe flexibility option - without the flexibilityNA 20 CASE 2: f the expected NPV without the flexibility option is negative, then Expected NPV with the flexibility option 21 Value of the Option 24 Note: If the expected NPV without the flexiblity option is negative, the project would not be 25 undertaken, in which case the project would have no effect on firm value (NPV o VALUE OF OPTION$270 What are input flexibility options and output flexibility options? How do flexibility options affect projects' NPVs and risk