

Answered step by step
Verified Expert Solution
Question
1 Approved Answer
I need the formulas to use on exel as well. Thank you just for clarification I do not need the AON, I have already completed
I need the formulas to use on exel as well. Thank you 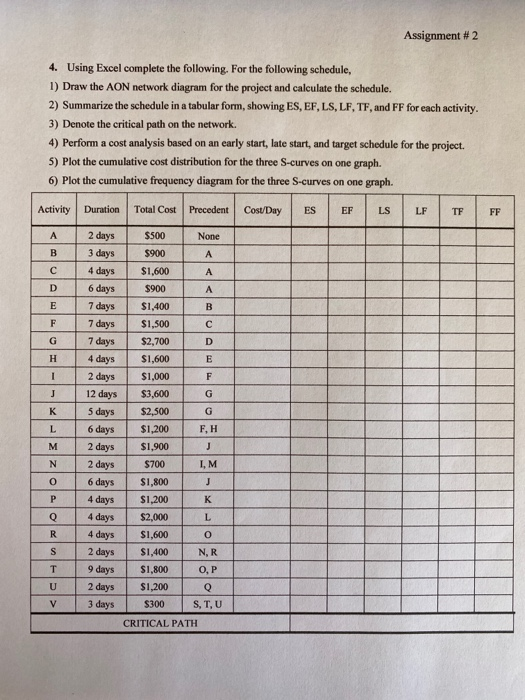 just for clarification I do not need the AON, I have already completed that part, I need help with the Gantt chart, and the S-curves graph. those two need to be do on excel and that is where I need the help. Thank you!! Assignment # 2 4. Using Excel complete the following. For the following schedule, 1) Draw the AON network diagram for the project and calculate the schedule. 2) Summarize the schedule in a tabular form, showing ES, EF, LS, LF, TF, and FF for each activity. 3) Denote the critical path on the network 4) Perform a cost analysis based on an early start, late start, and target schedule for the project. 5) Plot the cumulative cost distribution for the three S-curves on one graph. 6) Plot the cumulative frequency diagram for the three S-curves on one graph. Activity Duration Total Cost Precedent Cost/Day ES EF LS LF TF FF B D E F G H J K 2 days 3 days 4 days 6 days 7 days 7 days 7 days 4 days 2 days 12 days 5 days 6 days 2 days 2 days 6 days 4 days 4 days 4 days 2 days 9 days 2 days 3 days L $500 None $900 $1,600 $900 A $1,400 B $1,500 $2,700 D $1,600 E $1,000 F $3,600 G $2,500 G $1,200 F, H $1,900 J $700 IM $1,800 J $1,200 K $2,000 L $1,600 o $1,400 NR $1,800 O, P $1,200 Q $300 S,T,U CRITICAL PATH M N o P Q R S T U V Assignment # 2 4. Using Excel complete the following. For the following schedule, 1) Draw the AON network diagram for the project and calculate the schedule. 2) Summarize the schedule in a tabular form, showing ES, EF, LS, LF, TF, and FF for each activity. 3) Denote the critical path on the network 4) Perform a cost analysis based on an early start, late start, and target schedule for the project. 5) Plot the cumulative cost distribution for the three S-curves on one graph. 6) Plot the cumulative frequency diagram for the three S-curves on one graph. Activity Duration Total Cost Precedent Cost/Day ES EF LS LF TF FF B D E F G H J K 2 days 3 days 4 days 6 days 7 days 7 days 7 days 4 days 2 days 12 days 5 days 6 days 2 days 2 days 6 days 4 days 4 days 4 days 2 days 9 days 2 days 3 days L $500 None $900 $1,600 $900 A $1,400 B $1,500 $2,700 D $1,600 E $1,000 F $3,600 G $2,500 G $1,200 F, H $1,900 J $700 IM $1,800 J $1,200 K $2,000 L $1,600 o $1,400 NR $1,800 O, P $1,200 Q $300 S,T,U CRITICAL PATH M N o P Q R S T U V
I need the formulas to use on exel as well. Thank you
Step by Step Solution
There are 3 Steps involved in it
Step: 1

Get Instant Access to Expert-Tailored Solutions
See step-by-step solutions with expert insights and AI powered tools for academic success
Step: 2

Step: 3
Ace Your Homework with AI
Get the answers you need in no time with our AI-driven, step-by-step assistance
Get Started
Financial Accounting And Controlling In SAP AFS Solution
Authors: David Jones
1st Edition
1521738092, 978-1521738092