I need the second question answered to check my results. I need to double check my excel formulas. The first one has been answered.
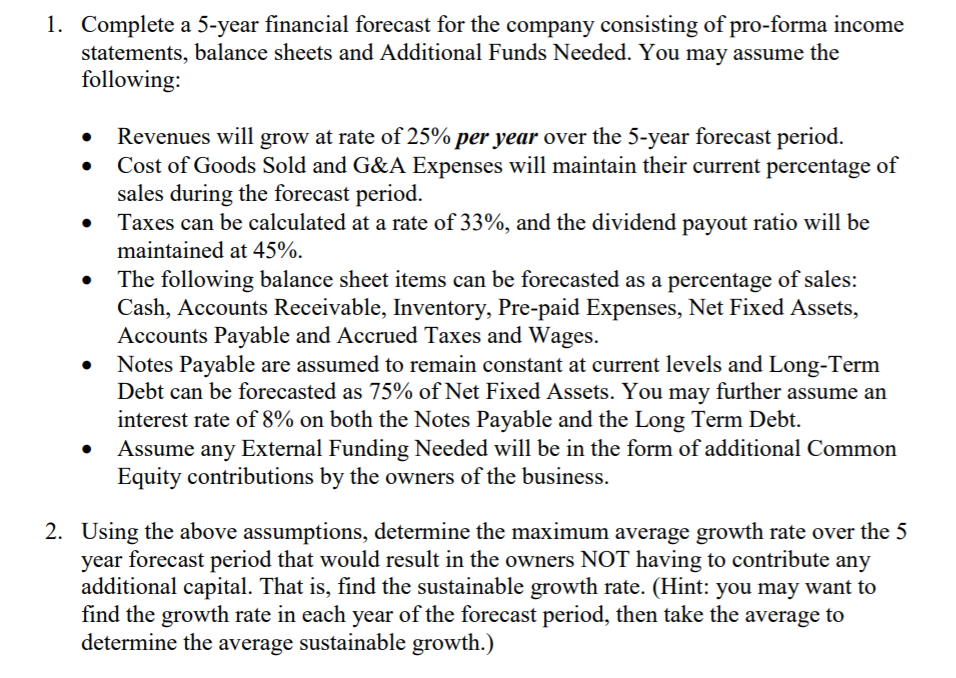
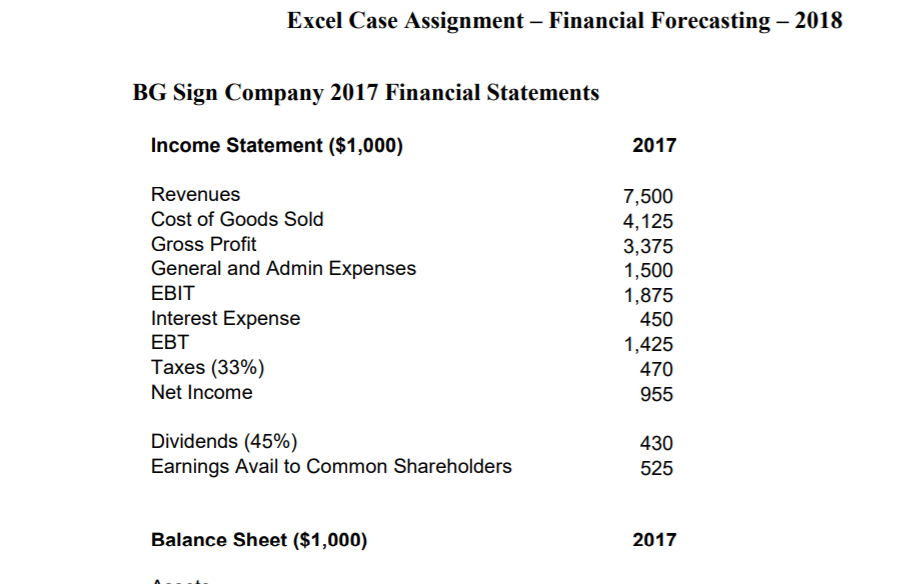
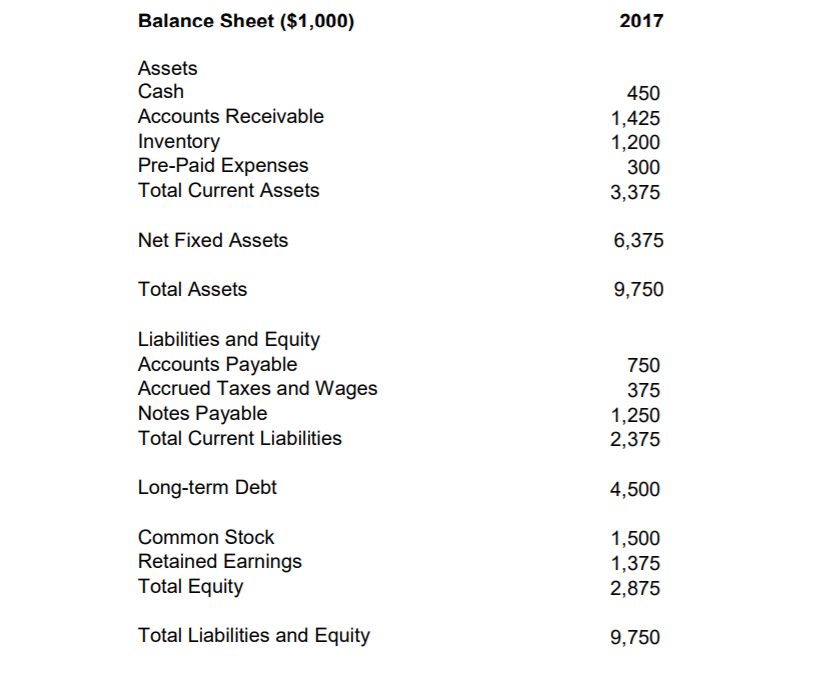
1. Complete a 5-year financial forecast for the company consisting of pro-forma income statements, balance sheets and Additional Funds Needed. You may assume the following: Revenues will grow at rate of 25% per year over the 5-year forecast period. Cost of Goods Sold and G&A Expenses will maintain their current percentage of sales during the forecast period. Taxes can be calculated at a rate of 33%, and the dividend payout ratio will be maintained at 45%. The following balance sheet items can be forecasted as a percentage of sales: Cash, Accounts Receivable, Inventory, Pre-paid Expenses, Net Fixed Assets, Accounts Payable and Accrued Taxes and Wages. Notes Payable are assumed to remain constant at current levels and Long-Term Debt can be forecasted as 75% of Net Fixed Assets. You may further assume an interest rate of 8% on both the Notes Payable and the Long Term Debt. Assume any External Funding Needed will be in the form of additional Common Equity contributions by the owners of the business. 2. Using the above assumptions, determine the maximum average growth rate over the 5 year forecast period that would result in the owners NOT having to contribute any additional capital. That is, find the sustainable growth rate. (Hint: you may want to find the growth rate in each year of the forecast period, then take the average to determine the average sustainable growth.) Excel Case Assignment - Financial Forecasting - 2018 BG Sign Company 2017 Financial Statements Income Statement ($1,000) 2017 Revenues Cost of Goods Sold Gross Profit General and Admin Expenses EBIT Interest Expense EBT Taxes (33%) Net Income 7,500 4,125 3,375 1,500 1,875 450 1,425 470 955 Dividends (45%) Earnings Avail to Common Shareholders 430 525 Balance Sheet ($1,000) 2017 Balance Sheet ($1,000) 2017 Assets Cash Accounts Receivable Inventory Pre-Paid Expenses Total Current Assets 450 1,425 1,200 300 3,375 Net Fixed Assets 6,375 Total Assets 9,750 750 Liabilities and Equity Accounts Payable Accrued Taxes and Wages Notes Payable Total Current Liabilities 375 1,250 2,375 Long-term Debt 4,500 Common Stock Retained Earnings Total Equity 1,500 1,375 2,875 Total Liabilities and Equity 9,750 1. Complete a 5-year financial forecast for the company consisting of pro-forma income statements, balance sheets and Additional Funds Needed. You may assume the following: Revenues will grow at rate of 25% per year over the 5-year forecast period. Cost of Goods Sold and G&A Expenses will maintain their current percentage of sales during the forecast period. Taxes can be calculated at a rate of 33%, and the dividend payout ratio will be maintained at 45%. The following balance sheet items can be forecasted as a percentage of sales: Cash, Accounts Receivable, Inventory, Pre-paid Expenses, Net Fixed Assets, Accounts Payable and Accrued Taxes and Wages. Notes Payable are assumed to remain constant at current levels and Long-Term Debt can be forecasted as 75% of Net Fixed Assets. You may further assume an interest rate of 8% on both the Notes Payable and the Long Term Debt. Assume any External Funding Needed will be in the form of additional Common Equity contributions by the owners of the business. 2. Using the above assumptions, determine the maximum average growth rate over the 5 year forecast period that would result in the owners NOT having to contribute any additional capital. That is, find the sustainable growth rate. (Hint: you may want to find the growth rate in each year of the forecast period, then take the average to determine the average sustainable growth.) Excel Case Assignment - Financial Forecasting - 2018 BG Sign Company 2017 Financial Statements Income Statement ($1,000) 2017 Revenues Cost of Goods Sold Gross Profit General and Admin Expenses EBIT Interest Expense EBT Taxes (33%) Net Income 7,500 4,125 3,375 1,500 1,875 450 1,425 470 955 Dividends (45%) Earnings Avail to Common Shareholders 430 525 Balance Sheet ($1,000) 2017 Balance Sheet ($1,000) 2017 Assets Cash Accounts Receivable Inventory Pre-Paid Expenses Total Current Assets 450 1,425 1,200 300 3,375 Net Fixed Assets 6,375 Total Assets 9,750 750 Liabilities and Equity Accounts Payable Accrued Taxes and Wages Notes Payable Total Current Liabilities 375 1,250 2,375 Long-term Debt 4,500 Common Stock Retained Earnings Total Equity 1,500 1,375 2,875 Total Liabilities and Equity 9,750