Answered step by step
Verified Expert Solution
Question
1 Approved Answer
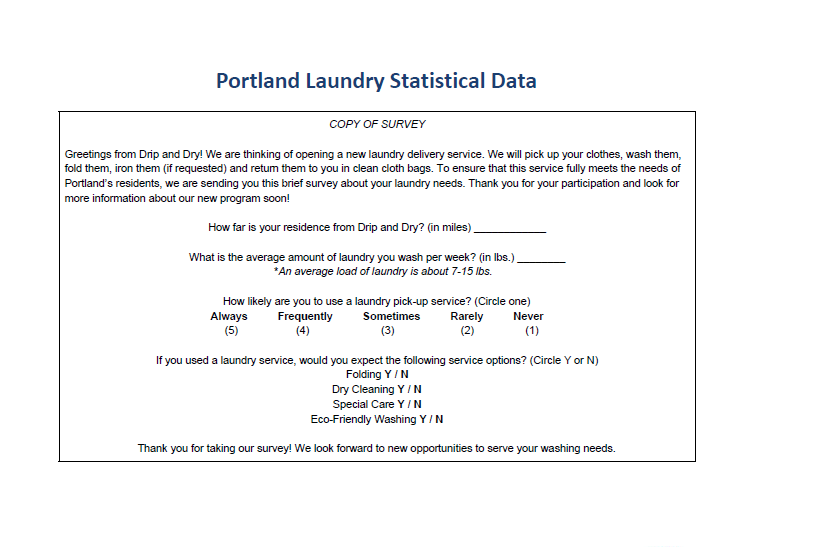
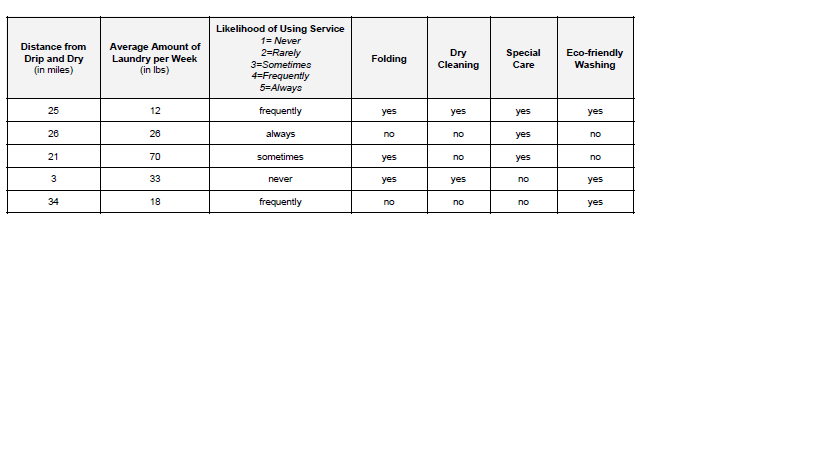
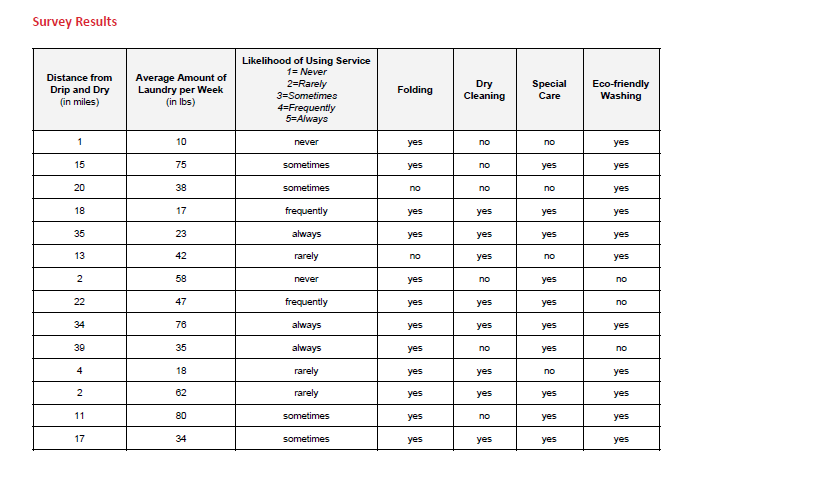
I need to analyze the raw data collected. and use Google Sheets, create two scatter plots: onecomparing the number of lbs. of laundry a household
I need to analyze the raw data collected. and use Google Sheets, create two scatter plots:
- onecomparing the number of lbs. of laundry a household does per week with the likelihood that they would use the service.
- another comparing a customer's distance from Drip & Dry with the likelihood of them using the service.
Icneed learn how to find the line of best fit, also known as a trend line, which approximates the data on the scatterplot and the R-squared values to help explain how close the data is to the trend line.I also have to explain whether or not there are meaningful correlations within the variables for each scatterplot (pounds of laundry vs. likelihood to use the service and distance vs. likelihood to use the service.)


Step by Step Solution
There are 3 Steps involved in it
Step: 1

Get Instant Access to Expert-Tailored Solutions
See step-by-step solutions with expert insights and AI powered tools for academic success
Step: 2

Step: 3

Ace Your Homework with AI
Get the answers you need in no time with our AI-driven, step-by-step assistance
Get Started


