

Answered step by step
Verified Expert Solution
Question
1 Approved Answer
I need to annotate this plot to show where the sinusoid is, how would i code this in Python 3.6 with matplotlib? plt.ylabel ( 'Welch
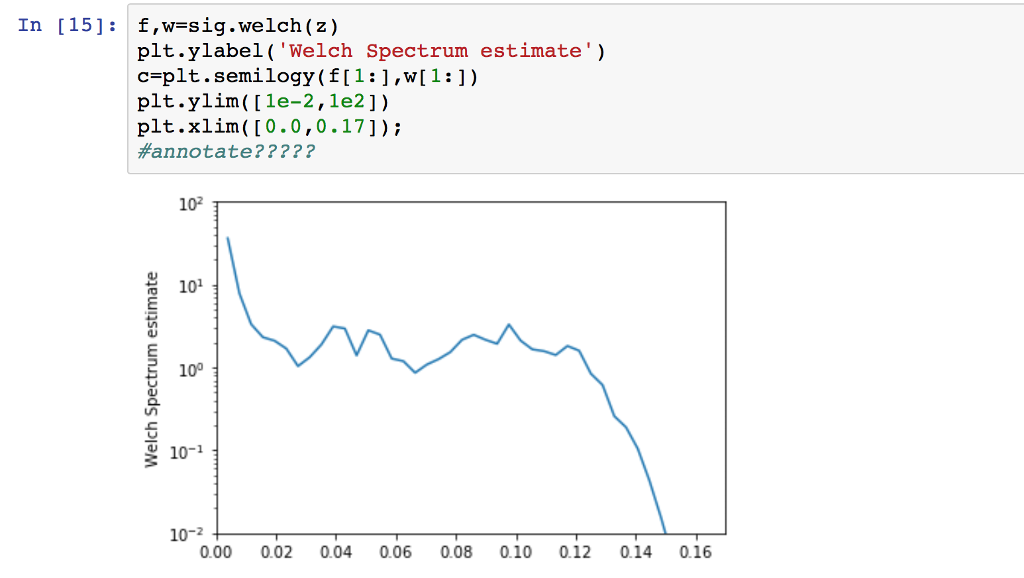 I need to annotate this plot to show where the sinusoid is, how would i code this in Python 3.6 with matplotlib?
Step by Step Solution
There are 3 Steps involved in it
Step: 1

Get Instant Access to Expert-Tailored Solutions
See step-by-step solutions with expert insights and AI powered tools for academic success
Step: 2

Step: 3
Ace Your Homework with AI
Get the answers you need in no time with our AI-driven, step-by-step assistance
Get Started
Database Development For Dummies
Authors: Allen G. Taylor
1st Edition
978-0764507526