

Question
I need to complete the worksheet ratio analysis and I am lost. the industry ratio totals I am almost certain are wrong those totals came
I need to complete the worksheet ratio analysis and I am lost. the industry ratio totals I am almost certain are wrong those totals came from the transportation schedule sheet and the company ratio totals came from the 2017 company data I need help with industry
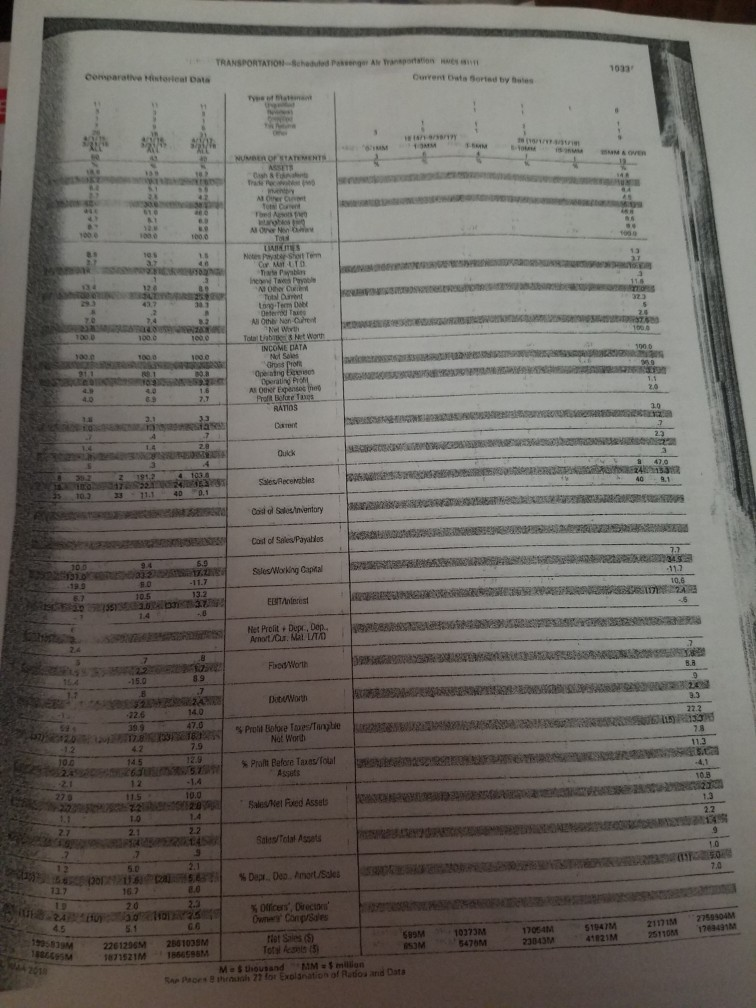
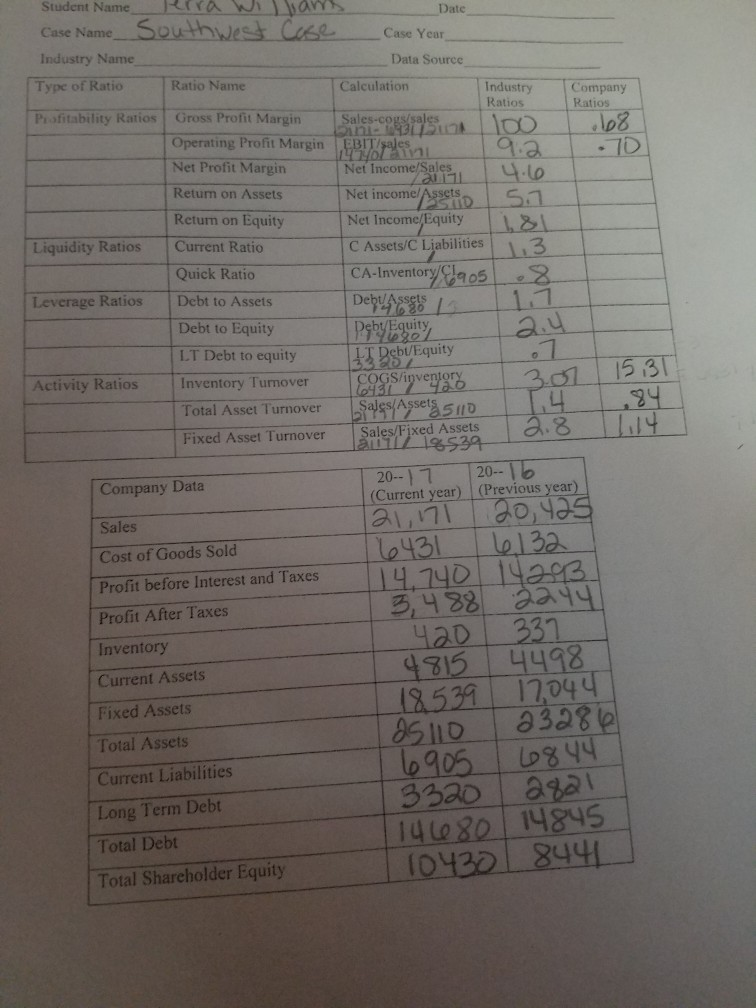

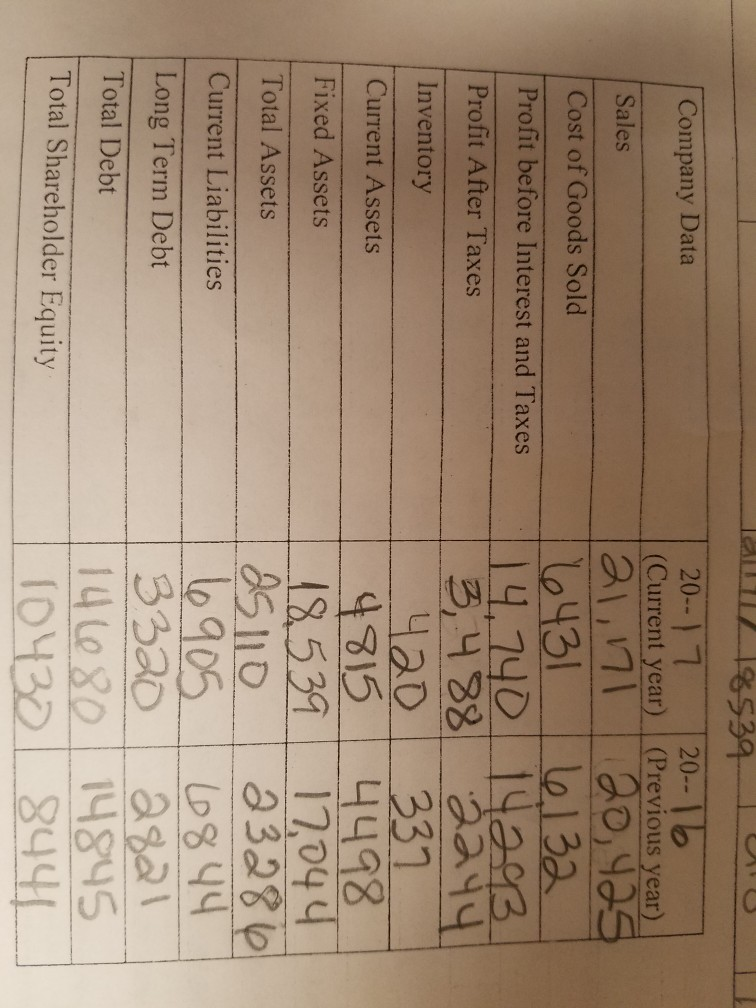
TRANSPORTATION --Scheduled sverger Air Transportation Cuvent started by the comparative Historical Data att IM NUMBER OF STATEMENTS Trade A Tot bedste 1000 MON TON LATES Notes Short Term Our Incwae NO C Tot Darren Term Det Alth None Ne With Total t Worth INCOME DATA Nel Sol Groot Opening 03 per FM ARON E nero Prof Bolo Tas RATIOS 1000 Da Quick S Sales Recebles ESEORARIS 11. 400.1 Coidal Sales/Inventory Cost of Sales Payables 6.0 Sales/Working Capital -11.7 10.5 RSS ELUT Anterest Met Prolit + Depe, Dop. Amort/Our LTD Fred Worth 24 DatWorth 226 399 47.6 Prold Golove loe/Tangle Not Worth 7.9 129 145 Prolt Before Taxes/foual 115 10.0 Baleel Red Assets 2.2 Sales/Tolat Assets 10 2.1 70 0 1301 116 2 5 .65 Der Do Amort/ 124 125 GO 51947M 10373M 5470M 12 4 2 93 AM 2511011179491 17054M 23843M Officers, Duet Ownery Canales Tier Sales (5) 99M Tots els 15 Showtand MM milion h 27 for Explanation of Radosand Data 1795810M BL 2 201206M 1 21M 14595M Bare Port Ratios . 108 Student NameRara Wibarys Date Case Name Southwest Case Case Year - Industry Name Data Source Type of Ratio Ratio Name Calculation Industry Company Ratios Profitability Ratios Gross Profit Margin Sales-cogs/sales, Dine 33 To Operating Profit Margin EBIT sales 9.a 10 La Net Profit Margin Net Income/Sales 4.6 Retum on Assets Net incomel Assetso 51 Return on Equity Net Income/Equity 1181 Liquidity Ratios Current Ratio C Assets/C Liabilities 1.3 Quick Ratio CA-Inventory C1905 .8 Leverage Ratios Debt to Assets DentAssets Debt to Equity Peby Equity LT Debt to equity 3325 1531 Activity Ratios Inventory Tumover COGS/inventory Total Asset Turnover Sales/Assets. 5110 Fixed Asset Turnover 12 19539 I 2017 2016 Company Data (Current year) (Previous year) IT Debt/Equity .94 Il Sales/Fixed Assets Sales Cost of Goods Sold Profit before Interest and Taxes Profit After Taxes Inventory Current Assets 21,171 6431 6132 14,740 14293 5,48 420 337 4815 4498 18539 12,044 Taslio 23286 T 6905 6844 3320 2821 146080 14845 10430 8440 Fixed Assets Total Assets Current Liabilities Long Term Debt Total Debt Total Shareholder Equity Ratios . 108 Student NameRara Wibarys Date Case Name Southwest Case Case Year - Industry Name Data Source Type of Ratio Ratio Name Calculation Industry Company Ratios Profitability Ratios Gross Profit Margin Sales-cogs/sales, Dine 33 To Operating Profit Margin EBIT sales 9.a 10 La Net Profit Margin Net Income/Sales 4.6 Retum on Assets Net incomel Assetso 51 Return on Equity Net Income/Equity 1181 Liquidity Ratios Current Ratio C Assets/C Liabilities 1.3 Quick Ratio CA-Inventory C1905 .8 Leverage Ratios Debt to Assets DentAssets Debt to Equity Peby Equity LT Debt to equity 3325 1531 Activity Ratios Inventory Tumover COGS/inventory Total Asset Turnover Sales/Assets. 5110 Fixed Asset Turnover 12 19539 I 2017 2016 Company Data (Current year) (Previous year) IT Debt/Equity .94 Il Sales/Fixed Assets Sales Cost of Goods Sold Profit before Interest and Taxes Profit After Taxes Inventory Current Assets 21,171 6431 6132 14,740 14293 5,48 420 337 4815 4498 18539 12,044 Taslio 23286 T 6905 6844 3320 2821 146080 14845 10430 8440 Fixed Assets Total Assets Current Liabilities Long Term Debt Total Debt Total Shareholder Equity Company Data Sales Cost of Goods Sold Profit before Interest and Taxes Profit After Taxes Inventory Current Assets Fixed Assets SALLLLL185391 20--17 20--16 (Current year) (Previous year) 21,01120,425 16431 6132 14,740 14203 3,488 2244 420 1 337 4815 4498 18 539 17,044 25110 23286 6905 1 6844 3320 | 2821 141680 14845 10430 1 8441 Total Assets Current Liabilities Long Term Debt Total Debt Total Shareholder Equity TRANSPORTATION --Scheduled sverger Air Transportation Cuvent started by the comparative Historical Data att IM NUMBER OF STATEMENTS Trade A Tot bedste 1000 MON TON LATES Notes Short Term Our Incwae NO C Tot Darren Term Det Alth None Ne With Total t Worth INCOME DATA Nel Sol Groot Opening 03 per FM ARON E nero Prof Bolo Tas RATIOS 1000 Da Quick S Sales Recebles ESEORARIS 11. 400.1 Coidal Sales/Inventory Cost of Sales Payables 6.0 Sales/Working Capital -11.7 10.5 RSS ELUT Anterest Met Prolit + Depe, Dop. Amort/Our LTD Fred Worth 24 DatWorth 226 399 47.6 Prold Golove loe/Tangle Not Worth 7.9 129 145 Prolt Before Taxes/foual 115 10.0 Baleel Red Assets 2.2 Sales/Tolat Assets 10 2.1 70 0 1301 116 2 5 .65 Der Do Amort/ 124 125 GO 51947M 10373M 5470M 12 4 2 93 AM 2511011179491 17054M 23843M Officers, Duet Ownery Canales Tier Sales (5) 99M Tots els 15 Showtand MM milion h 27 for Explanation of Radosand Data 1795810M BL 2 201206M 1 21M 14595M Bare Port Ratios . 108 Student NameRara Wibarys Date Case Name Southwest Case Case Year - Industry Name Data Source Type of Ratio Ratio Name Calculation Industry Company Ratios Profitability Ratios Gross Profit Margin Sales-cogs/sales, Dine 33 To Operating Profit Margin EBIT sales 9.a 10 La Net Profit Margin Net Income/Sales 4.6 Retum on Assets Net incomel Assetso 51 Return on Equity Net Income/Equity 1181 Liquidity Ratios Current Ratio C Assets/C Liabilities 1.3 Quick Ratio CA-Inventory C1905 .8 Leverage Ratios Debt to Assets DentAssets Debt to Equity Peby Equity LT Debt to equity 3325 1531 Activity Ratios Inventory Tumover COGS/inventory Total Asset Turnover Sales/Assets. 5110 Fixed Asset Turnover 12 19539 I 2017 2016 Company Data (Current year) (Previous year) IT Debt/Equity .94 Il Sales/Fixed Assets Sales Cost of Goods Sold Profit before Interest and Taxes Profit After Taxes Inventory Current Assets 21,171 6431 6132 14,740 14293 5,48 420 337 4815 4498 18539 12,044 Taslio 23286 T 6905 6844 3320 2821 146080 14845 10430 8440 Fixed Assets Total Assets Current Liabilities Long Term Debt Total Debt Total Shareholder Equity Ratios . 108 Student NameRara Wibarys Date Case Name Southwest Case Case Year - Industry Name Data Source Type of Ratio Ratio Name Calculation Industry Company Ratios Profitability Ratios Gross Profit Margin Sales-cogs/sales, Dine 33 To Operating Profit Margin EBIT sales 9.a 10 La Net Profit Margin Net Income/Sales 4.6 Retum on Assets Net incomel Assetso 51 Return on Equity Net Income/Equity 1181 Liquidity Ratios Current Ratio C Assets/C Liabilities 1.3 Quick Ratio CA-Inventory C1905 .8 Leverage Ratios Debt to Assets DentAssets Debt to Equity Peby Equity LT Debt to equity 3325 1531 Activity Ratios Inventory Tumover COGS/inventory Total Asset Turnover Sales/Assets. 5110 Fixed Asset Turnover 12 19539 I 2017 2016 Company Data (Current year) (Previous year) IT Debt/Equity .94 Il Sales/Fixed Assets Sales Cost of Goods Sold Profit before Interest and Taxes Profit After Taxes Inventory Current Assets 21,171 6431 6132 14,740 14293 5,48 420 337 4815 4498 18539 12,044 Taslio 23286 T 6905 6844 3320 2821 146080 14845 10430 8440 Fixed Assets Total Assets Current Liabilities Long Term Debt Total Debt Total Shareholder Equity Company Data Sales Cost of Goods Sold Profit before Interest and Taxes Profit After Taxes Inventory Current Assets Fixed Assets SALLLLL185391 20--17 20--16 (Current year) (Previous year) 21,01120,425 16431 6132 14,740 14203 3,488 2244 420 1 337 4815 4498 18 539 17,044 25110 23286 6905 1 6844 3320 | 2821 141680 14845 10430 1 8441 Total Assets Current Liabilities Long Term Debt Total Debt Total Shareholder Equity
Step by Step Solution
There are 3 Steps involved in it
Step: 1

Get Instant Access to Expert-Tailored Solutions
See step-by-step solutions with expert insights and AI powered tools for academic success
Step: 2

Step: 3
Ace Your Homework with AI
Get the answers you need in no time with our AI-driven, step-by-step assistance
Get Started
Fundamentals of Financial Management
Authors: Eugene F. Brigham
Concise 9th Edition
1305635937, 1305635930, 978-1305635937