I need to find the financial position for 2016, zoom in to see info better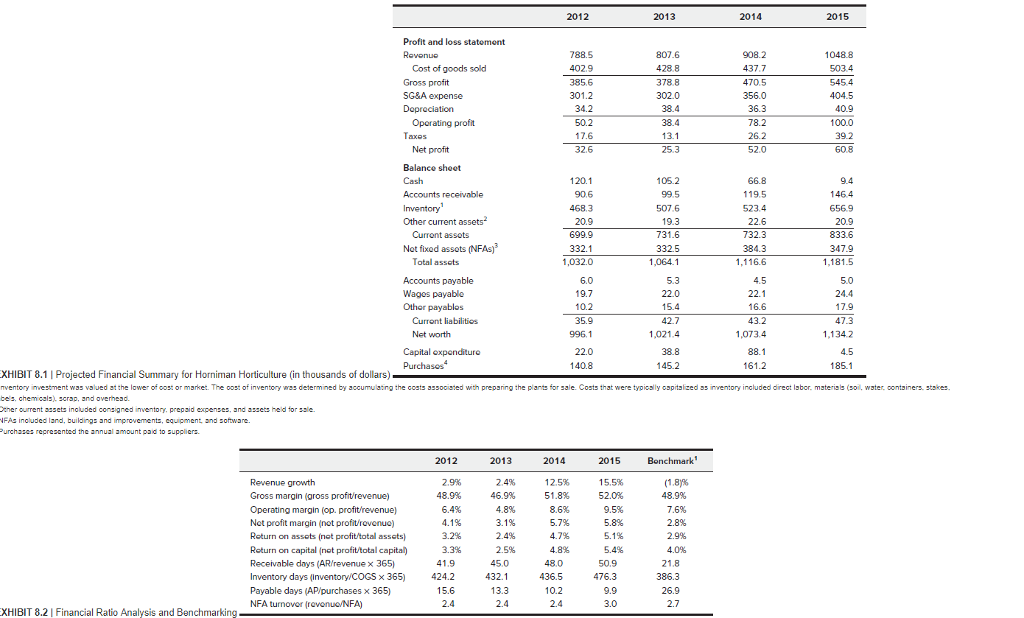
2012 2013 2014 2015 Profit and loss statement 788.5 402.9 385.6 807.6 428.8 378.8 302.0 908.2 437.7 470.5 356.0 1048.8 503.4 5454 404.5 40.9 100.0 39.2 60.8 Cost of goods sold Gross profit SG&A expense 38.4 13.1 Operating profit 50.2 17.6 78.2 26.2 Net profit Balance sheet 120.1 105.2 66.8 9.4 146.4 656.9 468.3 507.6 523.4 Other current as Current assots 732.3 699.9 332.1 1,032.0 731.6 332.5 1,064.1 833.6 347.9 Not fixod assots (NFAs) Total assets Accounts payable Wages payable Othor payablos 5.0 22.0 15.4 42.7 ,021.4 38.8 145.2 10.2 35.9 996.1 16.6 17.9 Curront liabilities Net wort 1,073.4 1,134.2 4.5 185.1 Capital expenditure 140.8 161.2 XHIBIT 8.1 | Projected Financial Summary for Horniman Horticulture (in thousands of dollars) vento y n est ent was valued at the lower o oost or man et The oost ofinventory was deter ned by accumula ng the costs 5500sed wth prepan g the parts or ale osts that were typ C3 ly 03pts ced 35 nye to included drect abor. m ster 501 water. oor tiners. stse ner ourrent assets inoluded consigned inventory, prepsid expenses, and assets held for sale IFAs inoluded land, builaings and improvements, cquipment and software. Purchas recrezented the annual amount pad to suppliers. 2012 2013 2015 Bonchmark 2014 12.5% 5, Revenue growth Gross margin (gross proft/revenue) Operating margin (op. profit/revenue) Not profit margin (not profit/rovonuo) Return on assots (nat profittotal assats) Return on capital (not profittotal capital Receivable days (AR/revenue x 365) Inventory days (inventory COGS x 365 424.2 Payable days (AP/purchases x 365) NFA turnovor (revenuNFA) 2.9% 48.9% 6.4% 15.5% 52.0% 48.9% 15% 2.8% 2.9% 4.0% 8% 8.6% 5.8% 2.4% 2.5% 4.7% 3.3% 5.4% 45.0 48.0 432.1 13.3 476.3 15.6 3.0 XHIBIT 8.2 Financial Ratio Analysis and Benchmarking 2012 2013 2014 2015 Profit and loss statement 788.5 402.9 385.6 807.6 428.8 378.8 302.0 908.2 437.7 470.5 356.0 1048.8 503.4 5454 404.5 40.9 100.0 39.2 60.8 Cost of goods sold Gross profit SG&A expense 38.4 13.1 Operating profit 50.2 17.6 78.2 26.2 Net profit Balance sheet 120.1 105.2 66.8 9.4 146.4 656.9 468.3 507.6 523.4 Other current as Current assots 732.3 699.9 332.1 1,032.0 731.6 332.5 1,064.1 833.6 347.9 Not fixod assots (NFAs) Total assets Accounts payable Wages payable Othor payablos 5.0 22.0 15.4 42.7 ,021.4 38.8 145.2 10.2 35.9 996.1 16.6 17.9 Curront liabilities Net wort 1,073.4 1,134.2 4.5 185.1 Capital expenditure 140.8 161.2 XHIBIT 8.1 | Projected Financial Summary for Horniman Horticulture (in thousands of dollars) vento y n est ent was valued at the lower o oost or man et The oost ofinventory was deter ned by accumula ng the costs 5500sed wth prepan g the parts or ale osts that were typ C3 ly 03pts ced 35 nye to included drect abor. m ster 501 water. oor tiners. stse ner ourrent assets inoluded consigned inventory, prepsid expenses, and assets held for sale IFAs inoluded land, builaings and improvements, cquipment and software. Purchas recrezented the annual amount pad to suppliers. 2012 2013 2015 Bonchmark 2014 12.5% 5, Revenue growth Gross margin (gross proft/revenue) Operating margin (op. profit/revenue) Not profit margin (not profit/rovonuo) Return on assots (nat profittotal assats) Return on capital (not profittotal capital Receivable days (AR/revenue x 365) Inventory days (inventory COGS x 365 424.2 Payable days (AP/purchases x 365) NFA turnovor (revenuNFA) 2.9% 48.9% 6.4% 15.5% 52.0% 48.9% 15% 2.8% 2.9% 4.0% 8% 8.6% 5.8% 2.4% 2.5% 4.7% 3.3% 5.4% 45.0 48.0 432.1 13.3 476.3 15.6 3.0 XHIBIT 8.2 Financial Ratio Analysis and Benchmarking