

Answered step by step
Verified Expert Solution
Question
1 Approved Answer
I need to find the Upper and lower limits for both X and R charts. Refer to Table S6.1 - Factors for Computing Control Chart
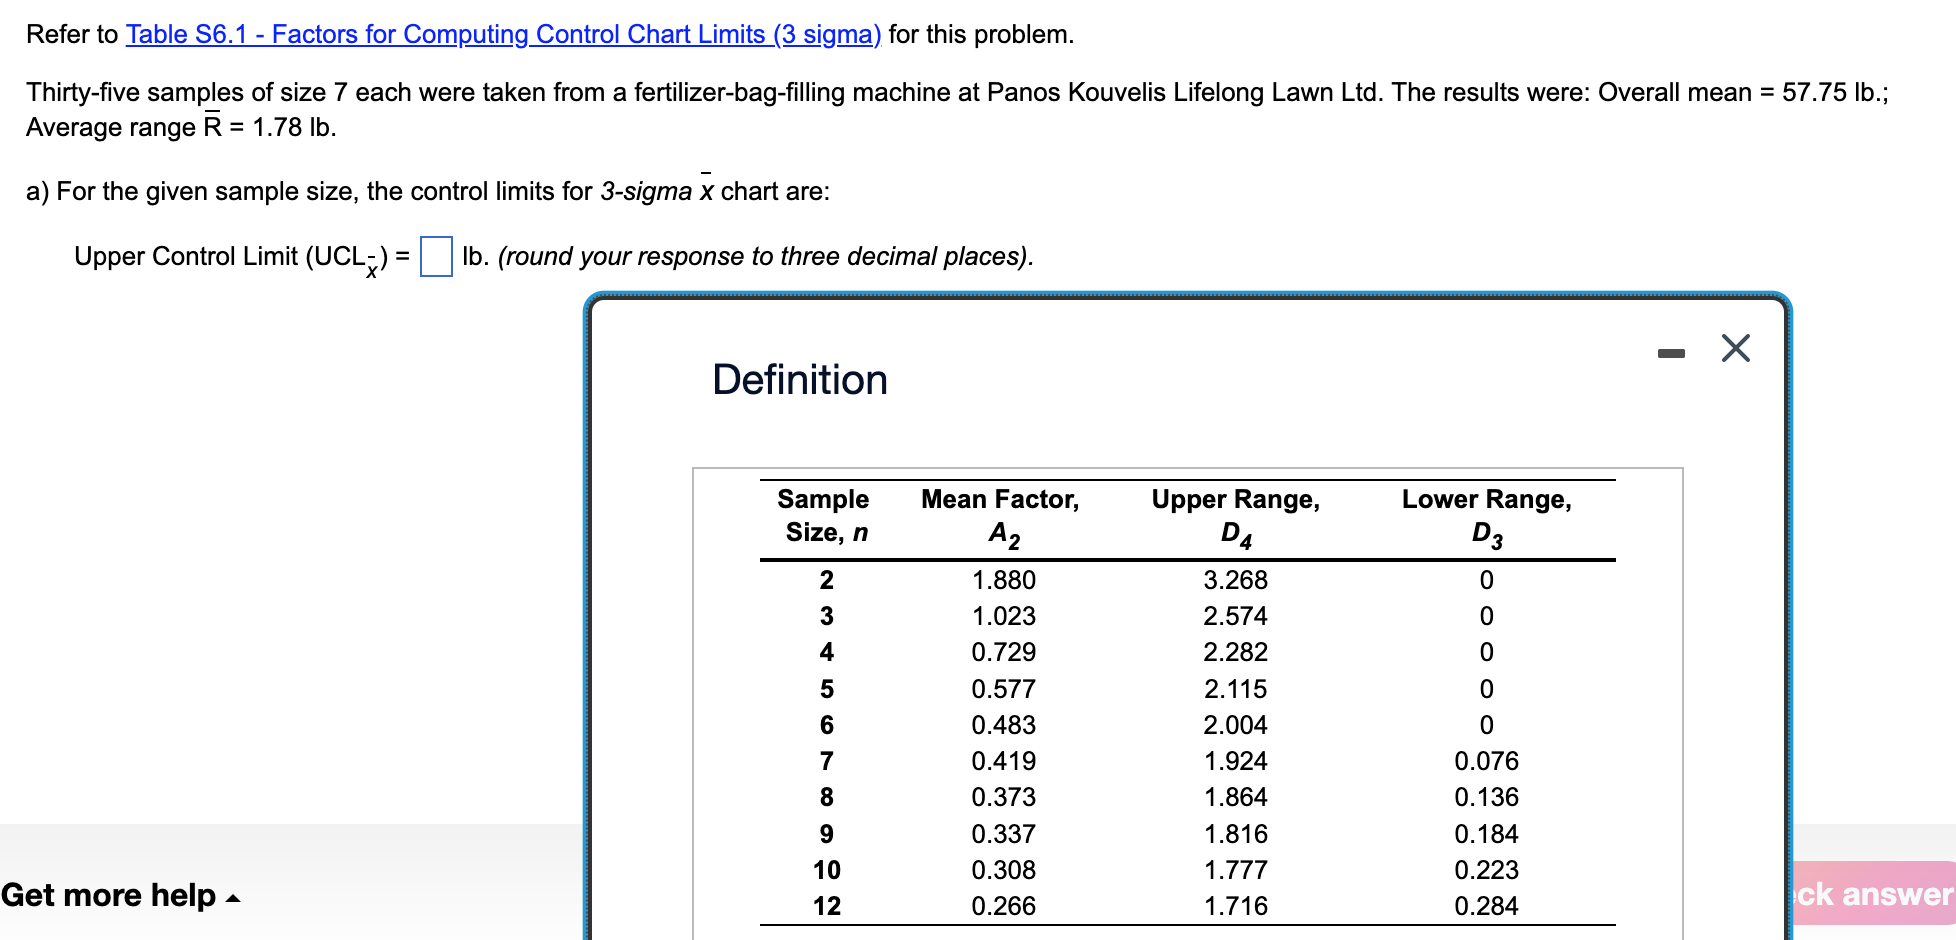
I need to find the Upper and lower limits for both X and R charts.
Refer to Table S6.1 - Factors for Computing Control Chart Limits (3 sigma) for this problem. Thirty-five samples of size 7 each were taken from a fertilizer-bag-filling machine at Panos Kouvelis Lifelong Lawn Ltd. The results were: Overall mean =57.75Ib.; Average range R=1.78lb. a) For the given sample size, the control limits for 3sigmax chart are: Upper Control Limit (UCLx)= Ib. (round your response to three decimal places). Definition Get more helpStep by Step Solution
There are 3 Steps involved in it
Step: 1

Get Instant Access to Expert-Tailored Solutions
See step-by-step solutions with expert insights and AI powered tools for academic success
Step: 2

Step: 3
Ace Your Homework with AI
Get the answers you need in no time with our AI-driven, step-by-step assistance
Get Started
The Clinical Audit In Pharmaceutical Development
Authors: Michael Hamrell
1st Edition
0367399334, 978-0367399337