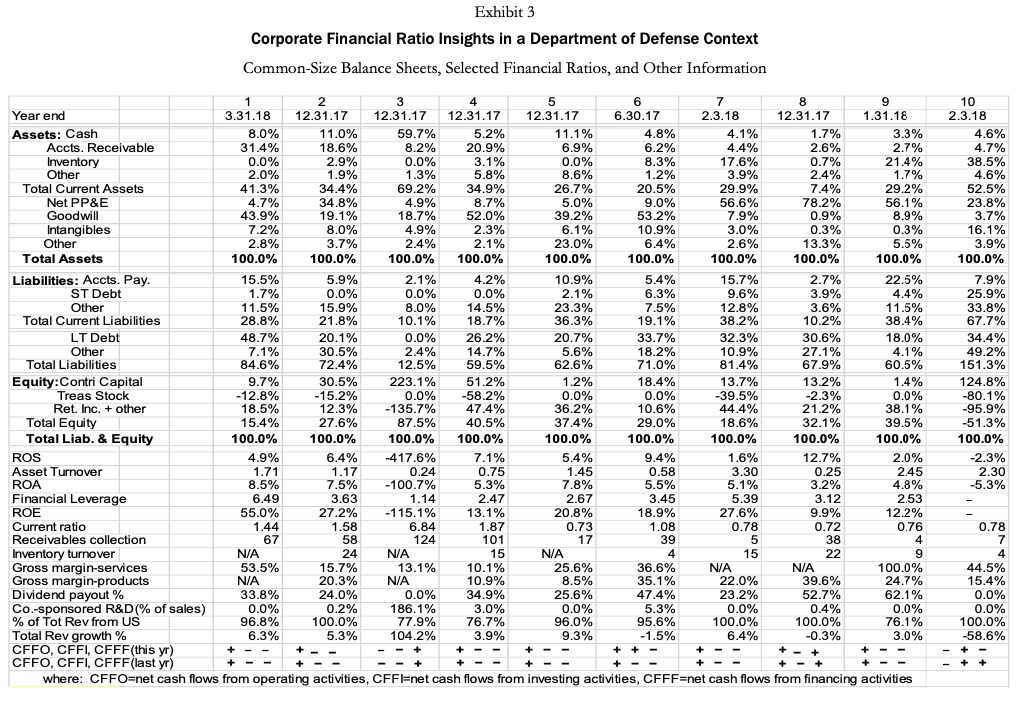
I need to match these ten industries using Exhibit 3: For example, Electrical Utility is #8 and Retail Grocery is #7. Please help! Thanks. I have 7 confirmed these are:
Each of the 10 publicly traded companies in Exhibit 3 is drawn from one of the following industries (listed below in random order):
I have 7 confirmed these are:
1. Management consulting services
2.
3. Data processing and camera applications services
4. Electronic, aerospace, communication, sensor systems
5. Hospital and medical service plans
6. Search, detection, navigation, guidance, aeronautical systems
7. Retail grocery stores
8. Electrical utility
I am missing:
1. Ship and boat building/repair (it is not #9 nor #10)
2. largemall department store chains (not #2 and not #9)
3. General merchandise retail stores (not #10 and not #2)
-
electrical utility
-
hospital and medical service plans
-
retail grocery stores
-
ship and boat building/repairing
-
electronic, aerospace, communication, sensor systems
-
data processing and camera applications services
-
search, detection, navigation, guidance, aeronautical systems
-
management consulting services
-
general merchandise retail stores
-
largemall department store chains
As best as you can, match the Exhibit 3 columns to each of the 10 industry/company descriptions above.

Exhibit 3 Corporate Financial Ratio Insights in a Department of Defense Context Common-Size Balance Sheets, Selected Financial Ratios, and Other Information 10 34 Year end 3.31.18 12.31.17 12.31.17 12.31.17 12.31.17 6.30.17 2.3.18 12.31.17 1.31.18 Assets: Cash 8.0% 11.0% 59.7% 5.2% 11.1% 4.8% 4.1% 1.7% 3.3% Accts. Receivable 31.4% 18.6% 8.2% 20.9% 6.9% 6.2% 4.4% 2.6% 2.7% Inventory 0.0% 2.9% 0.0% 3.1% 0.0% 8.3% 17.6% 0.7% 21.4% Other 2.0% 1.9% 1.3% 5.8% 8.6% 1.2% 3.9% 2.4% 1.7% Total Current Assets 41.3% 34.4% 69.2% 34.9% 26.7% 20.5% 29.9% 7.4% 29.2% Net PP&E 4.7% 34.8% 4.9% 8.7% 5.0% 9.0% 56.6% 78.2% 56.1% Goodwill 43.9% 19.1% 18.7% 52.0% 39.2% 53.2% 7.9% 0.9% 8.9% Intangibles 7.2% 8.0% 4.9% 2.3% 6.1% 10.9% 3.0% 0.3% 0.3% Other 2.8% 3.7% 2.4% 2.1% 23.0% 6.4% 2.6% 13.3% 5.5% Total Assets 100.0% 100.0% 100.0% 0.0% 100.0% 100.0% 100.0% 100.0% 100.0% 100.0% Liabilities: Accts. Pay. 15.5% 5.9% 2.1% 4.2% 10.9% 5.4% 15.7% 2.7% 22.5% ST Debt 1.7% 0.0% 0.0% 0.0% 2.1% 6.3% 9.6% 3.9% 4.4% Other 11.5% 15.9% 8.0% 14.5% 23.3% 7.5% 12.8% 3.6% 11.5% Total Current Liabilities 28.8% 21.8% 10.1% 18.7% 36.3% 19.1% 38.2% 10.2% 38.4% LT Debt 48.7% 20.1% 0.0% 26.2% 20.7% 33.7% 32.3% 30.6% 18.0% Other 7.1% 30.5% 2.4% 14.7% 5.6% 18.2% 10.9% 27.1% 4.1% Total Liabilities 84.6% 72.4% 12.5% 59.5% 62.6% 71.0% 81.4% 67.9% 60.5% Equity:Contri Capital 9.7% 30.5% 223.1% 51.2% 1.2% 18.4% 13.7% 13.2% 1.4% Treas Stock -12.8% -15.2% 0.0% -58.2% 0.0% 0.0% -39.5% -2.3% 0.0% Ret. Inc. + other 18.5% 12.3% -135.7% 47.4% 36.2% 10.6% 44.4% 21.2% 38.1% Total Equity 15.4% 27.6% 87.5% 40.5% 37.4% 29.0% 18.6% 32.1% 39.5% Total Liab. & Equity 100.0% 100.0% 100.0% 100.0% 100.0% 100.0% 100.0% 100.0% 100.0% ROS 4.9% 6.4% 417.6% 7.1% 5.4% 9.4% 1.6% 12.7% 2.0% Asset Turnover 1.71 1.17 0.24 0.75 1.45 0.58 3.30 0.25 2.45 ROA 8.5% 7.5% -100.7% 5.3% 7.8% 5.5% 5.1% 3.2% 4.8% Financial Leverage 6.49 3.63 1.14 2.47 2.67 3.45 5.39 3.12 2.53 ROE 55.0% 27.2% -115.1% 13.1% 20.8% 18.9% 27.6% 9.9% 12.2% Current ratio 1.44 1.58 0.73 1.08 0.78 0.72 0.76 Receivables collection 67 124 101 38 Inventory turnover N/A 15 N/A 15 22 Gross margin-services 53.5% 15.7% 13.1% 10.1% 25.6% 36.6% N/A NA 100.0% Gross margin-products 20.3% N/A 10.9% 8.5% 35.1% 22.0% 39.6% 24.7% Dividend payout % 33.8% 24.0% 0.0% 34.9% 25.6% 47.4% 23.2% 52.7% 62.1% Co.-sponsored R&D(% of sales) 0.0% 0.2% 186.1% 3.0% 0.0% 5.3% 0.0% 0.4% 0.0% % of Tot Rev from US 96.8% 100.0% 77.9% 76.7% 96.0% 95.6% 100.0% 100.0% 76.1% Total Rev growth % 6.3% 5.3% 104.2% 3.9% 9.3% -1.5% 6.4% -0.3% 3.0% CFFO, CFFI, CFFF(this yr) - - + + - - + + - + CFFO, CFFI, CFFF(last yr) + - - where: CFFO=net cash flows from operating activities, CFFI=net cash flows from investing activities, CFFF=net cash flows from financing activities polagang Stes PER FESTE ESARE STEESEE 4.6% 4.7% 38.5% 4.6% 52.5% 23.8% 3.7% 16.1% 3.9% 100.0% 7.9% 25.9% 33.8% 67.7% 34.4% 49.2% 151.3% 124.8% -80.1% -95.9% -51.3% 100.0% -2.3% 2.30 -5.3% 6.84 1.87 0.78 58 17 39 24 44.5% 15.4% 0.0% 0.0% 100.0% 58.6% - + +


