Answered step by step
Verified Expert Solution
Question
1 Approved Answer
I need to run two financial ratios- cant be basic earnings per share, return on assets or return on common share holders equity... I know
I need to run two financial ratios- cant be basic earnings per share, return on assets or return on common share holders equity... I know the pictures are a mess but any help even just formula wise will get a thumbs up! 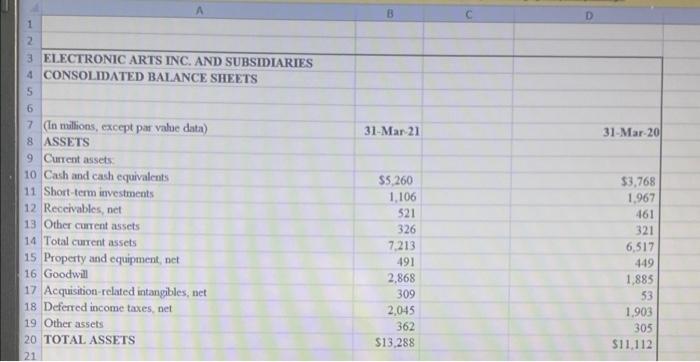
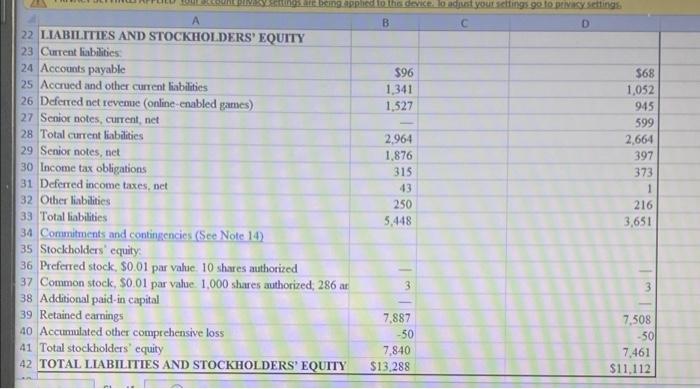
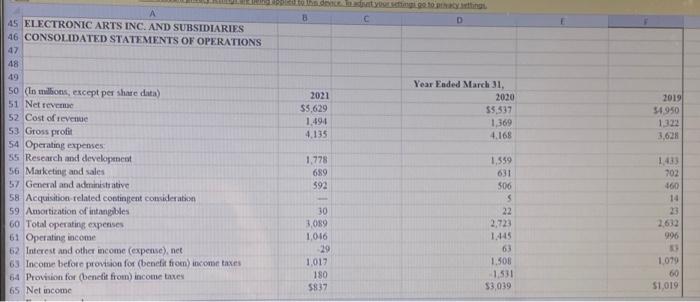
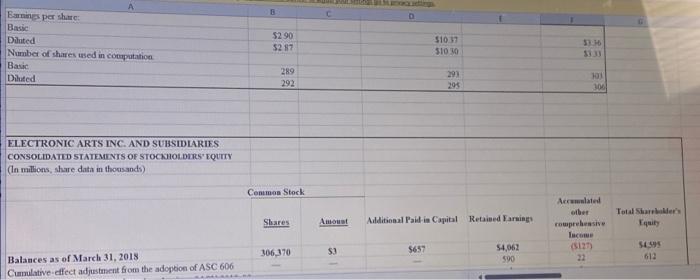
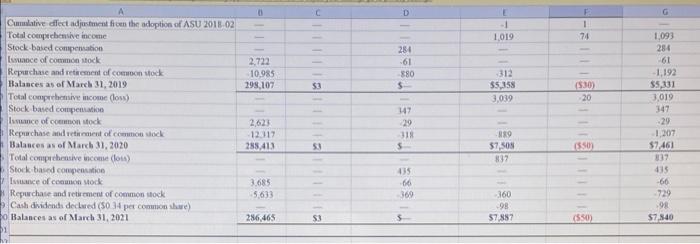
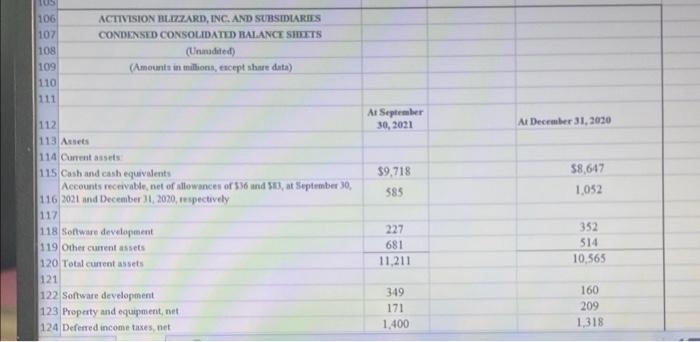
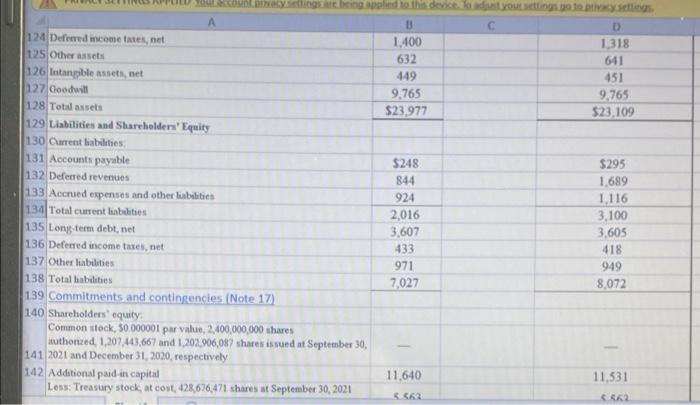
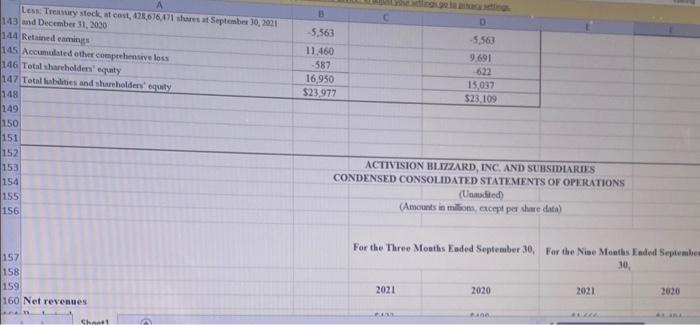
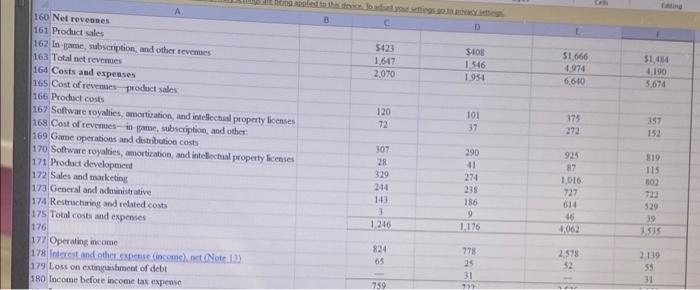
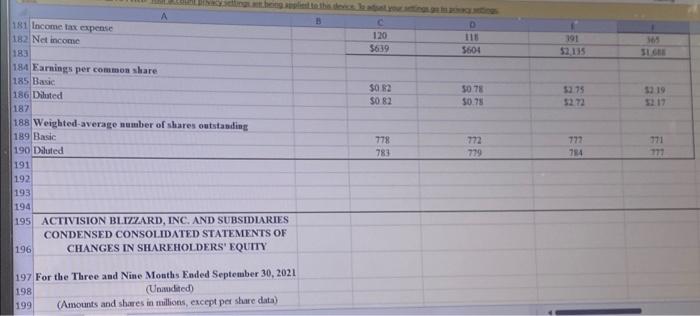
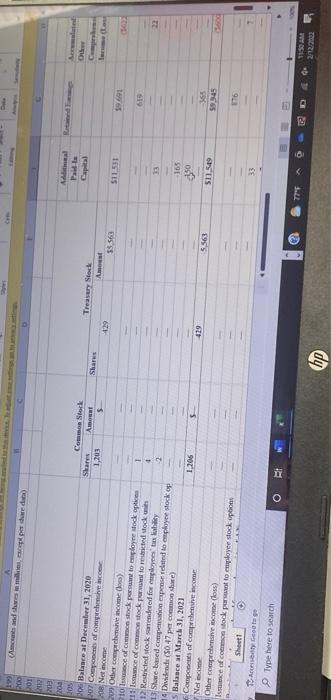
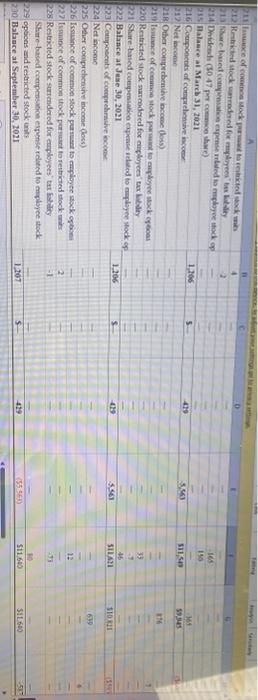
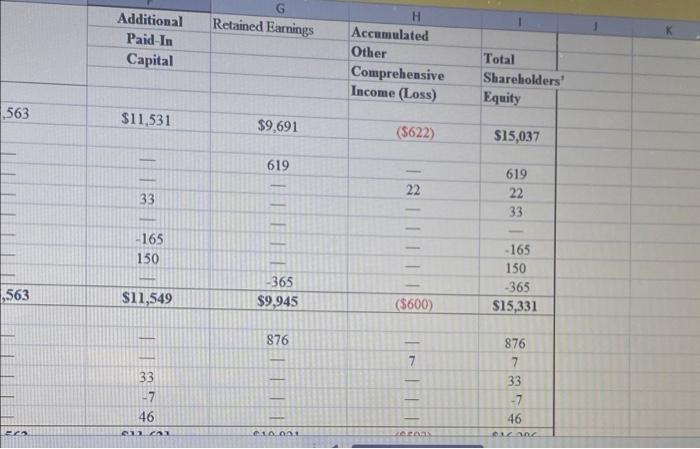
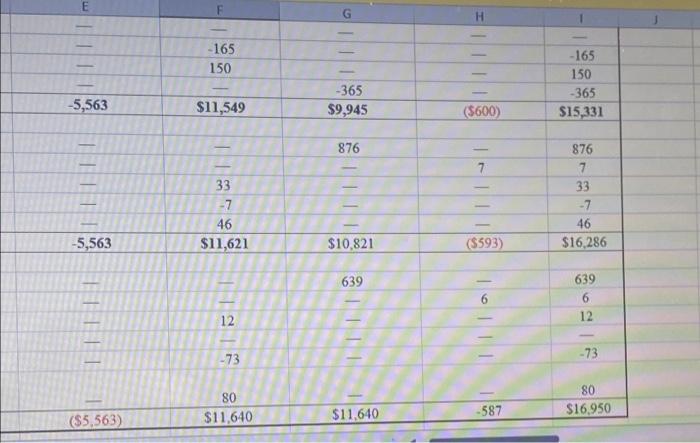
31 Mar 21 31-Mar-20 A 1 2 3 ELECTRONIC ARTS INC. AND SUBSIDIARIES 4 CONSOLIDATED BALANCE SHEETS 5 6 7 (In millions, except par value data) 8 ASSETS 9 Current assets 10 Cash and cash equivalents 11 Short-term investments 12 Receivables, net 13 Other current assets 14 Total current assets 15 Property and equipment, net 16 Goodwill 17 Acquisition related intangibles, net 18 Deferred income taxes, net 19 Other assets 20 TOTAL ASSETS 21 $5,260 1.106 521 326 7.213 491 2,868 309 2.045 362 $13,288 $3.768 1.967 461 321 6,517 449 1,885 53 1,903 305 $11,112 are being and to the device load young 90 to privating A B D 22 LIABILITIES AND STOCKHOLDERS' EQUITY 23 Current liabilities: 24 Accounts payable 596 $68 25 Accrued and other current liabilities 1,341 1,052 26 Deferred net revenue (online-enabled games) 1,527 9:45 27 Senior notes, current net 599 28 Total current liabilities 2.964 2,664 29 Senior notes, net 1.876 397 30 Income tax obligations 315 373 31 Deferred income taxes, net 43 1 32 Other liabilities 250 216 33 Total liabilities 5,448 3,651 34 Commitments and contingencies (See Note 14) 35 Stockholders' equity: 36 Preferred stock, $0.01 par value. 10 shares authorized 37 Common stock, 30.01 par value. 1,000 shares authorized, 286 ar 3 38 Additional paid-in capital 39 Retained carnings 7.887 7,308 40 Accumulated other comprehensive loss -50 -50 41 Total stockholders' equity 7.840 7.461 42 TOTAL LIABILITIES AND STOCKHOLDERS' EQUITY $13,288 $11,112 3 D 45 ELECTRONIC ARTS INC. AND SUBSIDIARIES 46 CONSOLIDATED STATEMENTS OF OPERATIONS 47 48 2021 55,629 1.494 4,135 Year Ended March 31, 2020 55,517 1,369 4.168 2019 54950 1.322 3,628 1,778 689 592 50 (In millions, except per share data) 51 Net reven 52 Cost of revenue 53 Gross profil 54 Operating expenses SS Research and development 56 Marketing and sales 57 General and administrative 58 Acquisition related contingent consideration 59 Amortization of intangibles 60 Total operating expenses 61 Operating income 62 Interest and other come (expense) net 63 Income before provision for (benefit from income taxes 64 Provision for (benefit from income taxes 65 Net income 1.433 702 460 1,559 631 506 $ 22 2,723 1445 63 1.508 1.531 $3.039 30 3,089 1016 29 1012 180 5837 23 2632 996 1.079 60 S1019 D A Earnings par share Basic Diluted Number of shares wed in computation Basic Diluted 52 90 $287 $10 31 510 10 3336 3333 289 292 293 205 103 304 ELECTRONIC ARTS INC. AND SUBSIDIARIES CONSOLIDATED STATEMENTS OF STOCKHOLDERS' EQUITY (In millions, share data in thousands) Conumen Stock Shares Total Sales Equity Amount Additional Paid in Capital Retained Earnings Acested ober comprehensive Income (5127 22 306,370 SO 5657 54,062 590 54.599 612 Balances as of March 31, 2018 Cumulative effect adjustment from the adoption of ASC 606 G TI 1 1,019 1 74 1,093 234 2.722 10.985 298, 107 312 $5,158 3,039 61 1,192 $5,331 3,019 (530) 20 Cumulative efect adjustment from the adoption of ASU 2018.02 Total comprehensive income Stock-based compensation Issuance of common stock Repuchate and retirement of common stock Balances as of March 31, 2019 Total comprehensive income oss) Stock based competition Iance of common stock Repurchase and retirement of common stock Balances as of March 31, 2020 Total comprehensive income (ou) Stock based compensation Instance of common stock Repurchase and retirement of common stock Cash dividend declared (S0 14 pet common are E Balances as of March 31, 2021 2,623 12.117 288.413 Illalla *3: 2 RO $7,505 832 -20 1,207 $7.461 23 425 -66 729 9 $7,840 3.685 5.633 360 98 57,887 286,465 S3 5 (550) 106 107 108 109 110 111 ACTIVISION BLIZZARD, INC. AND SUBSIDIARIES CONDENSED CONSOLIDATED BALANCE SHEETS (Unudited) (Amounts in millions, except share data) At September 30, 2021 At December 31, 2030 $9,718 385 58,647 1,052 112 113 Assets 114 Current assets 115 Cash and cash equivalents Accounts receivable net of allowances of 536 and 51), at September 30, 116 2021 and December 21, 2020, respectively 117 118 Software development 119 Other current assets 120 Total current assets 121 122 Software development 123 Property and equipment, et 124 Deferred income taxes, net 227 681 11,211 352 514 10,565 349 171 1.400 160 209 1,318 D 1,318 641 451 9,765 $23,109 singing applied to this device you go to A 3 124 Deferred income tates, net 1.400 125 Other assets 632 126 Intangible assets, net 449 127 Goodwill 9,765 128 Total assets $23.977 129 Liabilities and Shareholders' Equity 130 Current liabilities 131 Accounts payable $248 132 Deferred revenues 844 133 Accrued expenses and other liabilities 924 134 Total current liabities 2,016 135 Long term debt, net 3,607 136 Deferred income taxes, et 433 137 Other abilities 971 138 Total abilities 7,027 139 Commitments and contingencies (Note 17) 140 Shareholders' equity Common stock, 50.000001 par value, 2,400,000,000 shares authonzed. 1,207,443,667 and 1,202,906,087 shares issued at September 30, 141 2021 and December 31, 2020, respectively 142 Additional paid-in capital 11,640 Less: Treasury stock, at cost, 428,676,471 shares at September 30, 2021 >6 Issuance of common stock posto uployee stock om 222 tice of common stock pot restricted stock 228 Restricted stock surrendered for employees tarbiy Share-based compensation expense related to pee stock 229 options and restricted stocks 230 Balance at September 30, 2021 1.206 439 SISE SI141 SIRI TELTELINI 619 12 2 -1 10 $11.600 1.207 $ S1600 TA Retained Earnings Additional Paid-In Capital H Accumulated Other Comprehensive Income (Loss) Total Shareholders Equity 563 $11,531 $9.691 (5622) $15,037 619 22 33 619 22 33 - 1 1 | | | | -165 150 -165 150 -365 $15,331 ,563 -365 $9.945 $11,549 ($600) 876 7 33 -7 46 876 7 33 -7 46 EC ca CIAL Lea OT - 165 150 LI -165 150 -365 $15,331 -5,563 -365 $9,945 $11,549 (5600) 876 III 33 -7 46 $11,621 III 876 7 33 - 7 46 $16,286 -5,563 $10.821 ($593) 639 639 6 12 12 LI -73 -73 80 $11,640 80 $16.950 ($5,563) $11,640 -587 31 Mar 21 31-Mar-20 A 1 2 3 ELECTRONIC ARTS INC. AND SUBSIDIARIES 4 CONSOLIDATED BALANCE SHEETS 5 6 7 (In millions, except par value data) 8 ASSETS 9 Current assets 10 Cash and cash equivalents 11 Short-term investments 12 Receivables, net 13 Other current assets 14 Total current assets 15 Property and equipment, net 16 Goodwill 17 Acquisition related intangibles, net 18 Deferred income taxes, net 19 Other assets 20 TOTAL ASSETS 21 $5,260 1.106 521 326 7.213 491 2,868 309 2.045 362 $13,288 $3.768 1.967 461 321 6,517 449 1,885 53 1,903 305 $11,112 are being and to the device load young 90 to privating A B D 22 LIABILITIES AND STOCKHOLDERS' EQUITY 23 Current liabilities: 24 Accounts payable 596 $68 25 Accrued and other current liabilities 1,341 1,052 26 Deferred net revenue (online-enabled games) 1,527 9:45 27 Senior notes, current net 599 28 Total current liabilities 2.964 2,664 29 Senior notes, net 1.876 397 30 Income tax obligations 315 373 31 Deferred income taxes, net 43 1 32 Other liabilities 250 216 33 Total liabilities 5,448 3,651 34 Commitments and contingencies (See Note 14) 35 Stockholders' equity: 36 Preferred stock, $0.01 par value. 10 shares authorized 37 Common stock, 30.01 par value. 1,000 shares authorized, 286 ar 3 38 Additional paid-in capital 39 Retained carnings 7.887 7,308 40 Accumulated other comprehensive loss -50 -50 41 Total stockholders' equity 7.840 7.461 42 TOTAL LIABILITIES AND STOCKHOLDERS' EQUITY $13,288 $11,112 3 D 45 ELECTRONIC ARTS INC. AND SUBSIDIARIES 46 CONSOLIDATED STATEMENTS OF OPERATIONS 47 48 2021 55,629 1.494 4,135 Year Ended March 31, 2020 55,517 1,369 4.168 2019 54950 1.322 3,628 1,778 689 592 50 (In millions, except per share data) 51 Net reven 52 Cost of revenue 53 Gross profil 54 Operating expenses SS Research and development 56 Marketing and sales 57 General and administrative 58 Acquisition related contingent consideration 59 Amortization of intangibles 60 Total operating expenses 61 Operating income 62 Interest and other come (expense) net 63 Income before provision for (benefit from income taxes 64 Provision for (benefit from income taxes 65 Net income 1.433 702 460 1,559 631 506 $ 22 2,723 1445 63 1.508 1.531 $3.039 30 3,089 1016 29 1012 180 5837 23 2632 996 1.079 60 S1019 D A Earnings par share Basic Diluted Number of shares wed in computation Basic Diluted 52 90 $287 $10 31 510 10 3336 3333 289 292 293 205 103 304 ELECTRONIC ARTS INC. AND SUBSIDIARIES CONSOLIDATED STATEMENTS OF STOCKHOLDERS' EQUITY (In millions, share data in thousands) Conumen Stock Shares Total Sales Equity Amount Additional Paid in Capital Retained Earnings Acested ober comprehensive Income (5127 22 306,370 SO 5657 54,062 590 54.599 612 Balances as of March 31, 2018 Cumulative effect adjustment from the adoption of ASC 606 G TI 1 1,019 1 74 1,093 234 2.722 10.985 298, 107 312 $5,158 3,039 61 1,192 $5,331 3,019 (530) 20 Cumulative efect adjustment from the adoption of ASU 2018.02 Total comprehensive income Stock-based compensation Issuance of common stock Repuchate and retirement of common stock Balances as of March 31, 2019 Total comprehensive income oss) Stock based competition Iance of common stock Repurchase and retirement of common stock Balances as of March 31, 2020 Total comprehensive income (ou) Stock based compensation Instance of common stock Repurchase and retirement of common stock Cash dividend declared (S0 14 pet common are E Balances as of March 31, 2021 2,623 12.117 288.413 Illalla *3: 2 RO $7,505 832 -20 1,207 $7.461 23 425 -66 729 9 $7,840 3.685 5.633 360 98 57,887 286,465 S3 5 (550) 106 107 108 109 110 111 ACTIVISION BLIZZARD, INC. AND SUBSIDIARIES CONDENSED CONSOLIDATED BALANCE SHEETS (Unudited) (Amounts in millions, except share data) At September 30, 2021 At December 31, 2030 $9,718 385 58,647 1,052 112 113 Assets 114 Current assets 115 Cash and cash equivalents Accounts receivable net of allowances of 536 and 51), at September 30, 116 2021 and December 21, 2020, respectively 117 118 Software development 119 Other current assets 120 Total current assets 121 122 Software development 123 Property and equipment, et 124 Deferred income taxes, net 227 681 11,211 352 514 10,565 349 171 1.400 160 209 1,318 D 1,318 641 451 9,765 $23,109 singing applied to this device you go to A 3 124 Deferred income tates, net 1.400 125 Other assets 632 126 Intangible assets, net 449 127 Goodwill 9,765 128 Total assets $23.977 129 Liabilities and Shareholders' Equity 130 Current liabilities 131 Accounts payable $248 132 Deferred revenues 844 133 Accrued expenses and other liabilities 924 134 Total current liabities 2,016 135 Long term debt, net 3,607 136 Deferred income taxes, et 433 137 Other abilities 971 138 Total abilities 7,027 139 Commitments and contingencies (Note 17) 140 Shareholders' equity Common stock, 50.000001 par value, 2,400,000,000 shares authonzed. 1,207,443,667 and 1,202,906,087 shares issued at September 30, 141 2021 and December 31, 2020, respectively 142 Additional paid-in capital 11,640 Less: Treasury stock, at cost, 428,676,471 shares at September 30, 2021 >6 Issuance of common stock posto uployee stock om 222 tice of common stock pot restricted stock 228 Restricted stock surrendered for employees tarbiy Share-based compensation expense related to pee stock 229 options and restricted stocks 230 Balance at September 30, 2021 1.206 439 SISE SI141 SIRI TELTELINI 619 12 2 -1 10 $11.600 1.207 $ S1600 TA Retained Earnings Additional Paid-In Capital H Accumulated Other Comprehensive Income (Loss) Total Shareholders Equity 563 $11,531 $9.691 (5622) $15,037 619 22 33 619 22 33 - 1 1 | | | | -165 150 -165 150 -365 $15,331 ,563 -365 $9.945 $11,549 ($600) 876 7 33 -7 46 876 7 33 -7 46 EC ca CIAL Lea OT - 165 150 LI -165 150 -365 $15,331 -5,563 -365 $9,945 $11,549 (5600) 876 III 33 -7 46 $11,621 III 876 7 33 - 7 46 $16,286 -5,563 $10.821 ($593) 639 639 6 12 12 LI -73 -73 80 $11,640 80 $16.950 ($5,563) $11,640 -587 


Step by Step Solution
There are 3 Steps involved in it
Step: 1

Get Instant Access to Expert-Tailored Solutions
See step-by-step solutions with expert insights and AI powered tools for academic success
Step: 2

Step: 3

Ace Your Homework with AI
Get the answers you need in no time with our AI-driven, step-by-step assistance
Get Started


