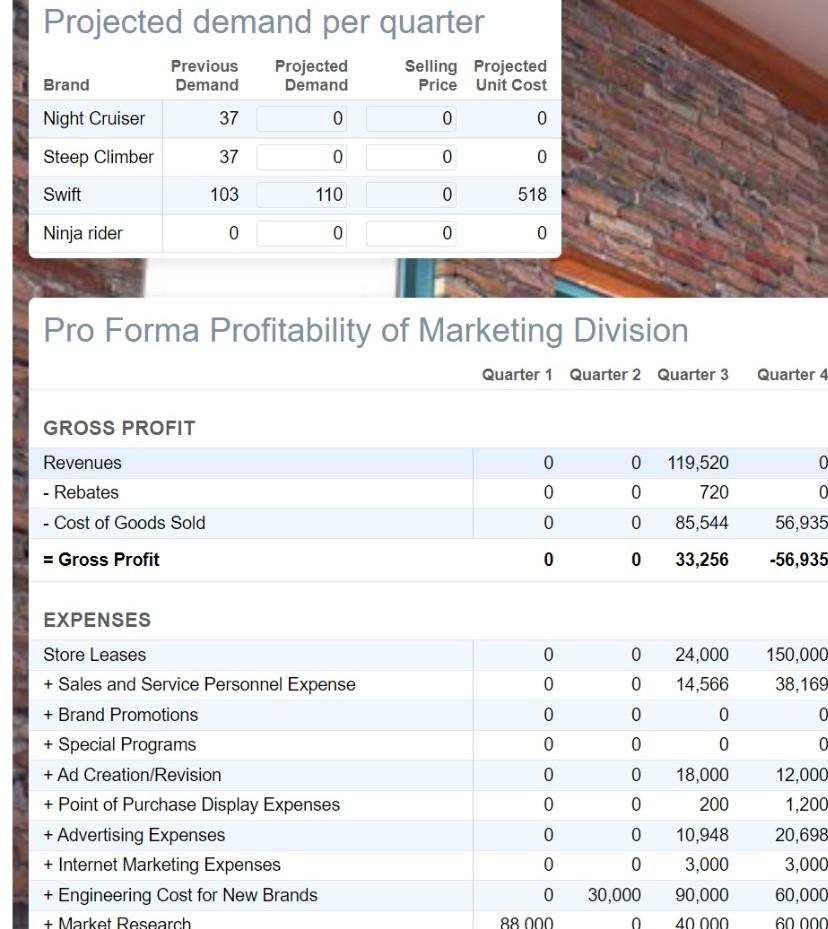
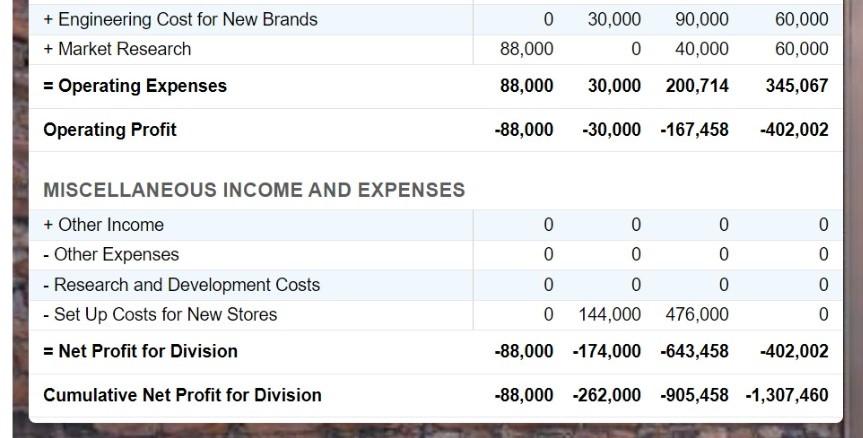
Show specific prices for each brand and estimate demand (number of units sold) for each quarter. Use the prices and demand estimates to forecast sales for each quarter. Display the resulting data on a pro forma profit and loss statement for Quarters 5-8.


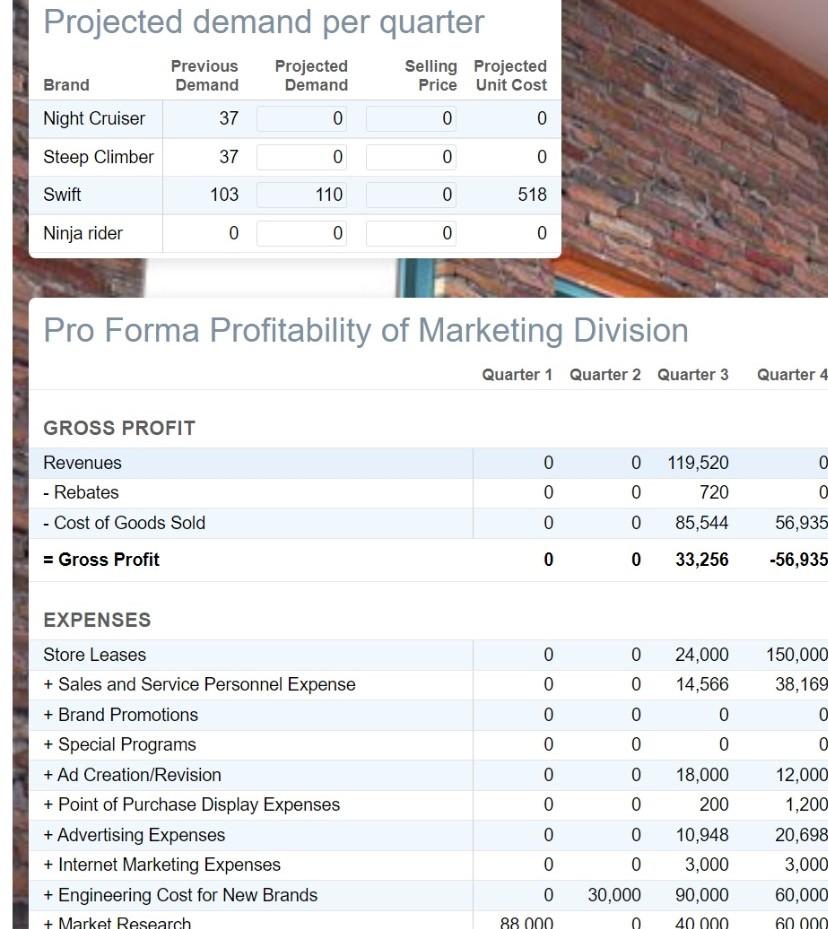
Projected demand per quarter Previous Demand 37 Brand Night Cruiser Projected Demand 0 Selling Projected Price Unit Cost 0 0 Steep Climber 37 0 0 0 Swift 103 110 0 518 Ninja rider 0 0 0 0 Pro Forma Profitability of Marketing Division Quarter 1 Quarter 2 Quarter 3 Quarter 4 0 GROSS PROFIT Revenues - Rebates - Cost of Goods Sold = Gross Profit 0 0 119,520 720 O 56,935 0 85,544 0 0 33,256 -56,935 0 0 0 0 0 0 150,000 38,169 0 0 0 0 EXPENSES Store Leases + Sales and Service Personnel Expense + Brand Promotions + Special Programs + Ad Creation/Revision + Point of Purchase Display Expenses + Advertising Expenses + Internet Marketing Expenses + Engineering Cost for New Brands + Market Research 0 0 0 24,000 14,566 0 0 18,000 200 10,948 3,000 90,000 40 000 0 0 0 0 0 30,000 12,000 1,200 20,698 3,000 60,000 0 88 000 60 000 Projected demand per quarter Previous Demand 37 Brand Night Cruiser Projected Demand 0 Selling Projected Price Unit Cost 0 0 Steep Climber 37 0 0 0 Swift 103 110 0 518 Ninja rider 0 0 0 0 Pro Forma Profitability of Marketing Division Quarter 1 Quarter 2 Quarter 3 Quarter 4 0 GROSS PROFIT Revenues - Rebates - Cost of Goods Sold = Gross Profit 0 0 119,520 720 O 56,935 0 85,544 0 0 33,256 -56,935 0 0 0 0 0 0 150,000 38,169 0 0 0 0 EXPENSES Store Leases + Sales and Service Personnel Expense + Brand Promotions + Special Programs + Ad Creation/Revision + Point of Purchase Display Expenses + Advertising Expenses + Internet Marketing Expenses + Engineering Cost for New Brands + Market Research 0 0 0 24,000 14,566 0 0 18,000 200 10,948 3,000 90,000 40 000 0 0 0 0 0 30,000 12,000 1,200 20,698 3,000 60,000 0 88 000 60 000 + Engineering Cost for New Brands + Market Research 0 88,000 30,000 0 90,000 40,000 60,000 60,000 = Operating Expenses 88,000 30,000 200,714 345,067 Operating Profit -88,000 -30,000 -167,458 -402,002 0 0 0 - 0 MISCELLANEOUS INCOME AND EXPENSES + Other Income - Other Expenses - Research and Development Costs - Set Up Costs for New Stores = Net Profit for Division 0 0 0 0 0 0 144,000 476,000 0 0 0 0 -88,000 -174,000 -643,458 -402,002 Cumulative Net Profit for Division -88,000 -262,000 -905,458 -1,307,460 Projected demand per quarter Previous Demand 37 Brand Night Cruiser Projected Demand 0 Selling Projected Price Unit Cost 0 0 Steep Climber 37 0 0 0 Swift 103 110 0 518 Ninja rider 0 0 0 0 Pro Forma Profitability of Marketing Division Quarter 1 Quarter 2 Quarter 3 Quarter 4 0 GROSS PROFIT Revenues - Rebates - Cost of Goods Sold = Gross Profit 0 0 119,520 720 O 56,935 0 85,544 0 0 33,256 -56,935 0 0 0 0 0 0 150,000 38,169 0 0 0 0 EXPENSES Store Leases + Sales and Service Personnel Expense + Brand Promotions + Special Programs + Ad Creation/Revision + Point of Purchase Display Expenses + Advertising Expenses + Internet Marketing Expenses + Engineering Cost for New Brands + Market Research 0 0 0 24,000 14,566 0 0 18,000 200 10,948 3,000 90,000 40 000 0 0 0 0 0 30,000 12,000 1,200 20,698 3,000 60,000 0 88 000 60 000 Projected demand per quarter Previous Demand 37 Brand Night Cruiser Projected Demand 0 Selling Projected Price Unit Cost 0 0 Steep Climber 37 0 0 0 Swift 103 110 0 518 Ninja rider 0 0 0 0 Pro Forma Profitability of Marketing Division Quarter 1 Quarter 2 Quarter 3 Quarter 4 0 GROSS PROFIT Revenues - Rebates - Cost of Goods Sold = Gross Profit 0 0 119,520 720 O 56,935 0 85,544 0 0 33,256 -56,935 0 0 0 0 0 0 150,000 38,169 0 0 0 0 EXPENSES Store Leases + Sales and Service Personnel Expense + Brand Promotions + Special Programs + Ad Creation/Revision + Point of Purchase Display Expenses + Advertising Expenses + Internet Marketing Expenses + Engineering Cost for New Brands + Market Research 0 0 0 24,000 14,566 0 0 18,000 200 10,948 3,000 90,000 40 000 0 0 0 0 0 30,000 12,000 1,200 20,698 3,000 60,000 0 88 000 60 000 + Engineering Cost for New Brands + Market Research 0 88,000 30,000 0 90,000 40,000 60,000 60,000 = Operating Expenses 88,000 30,000 200,714 345,067 Operating Profit -88,000 -30,000 -167,458 -402,002 0 0 0 - 0 MISCELLANEOUS INCOME AND EXPENSES + Other Income - Other Expenses - Research and Development Costs - Set Up Costs for New Stores = Net Profit for Division 0 0 0 0 0 0 144,000 476,000 0 0 0 0 -88,000 -174,000 -643,458 -402,002 Cumulative Net Profit for Division -88,000 -262,000 -905,458 -1,307,460


