Answered step by step
Verified Expert Solution
Link Copied!

Question

1 Approved Answer

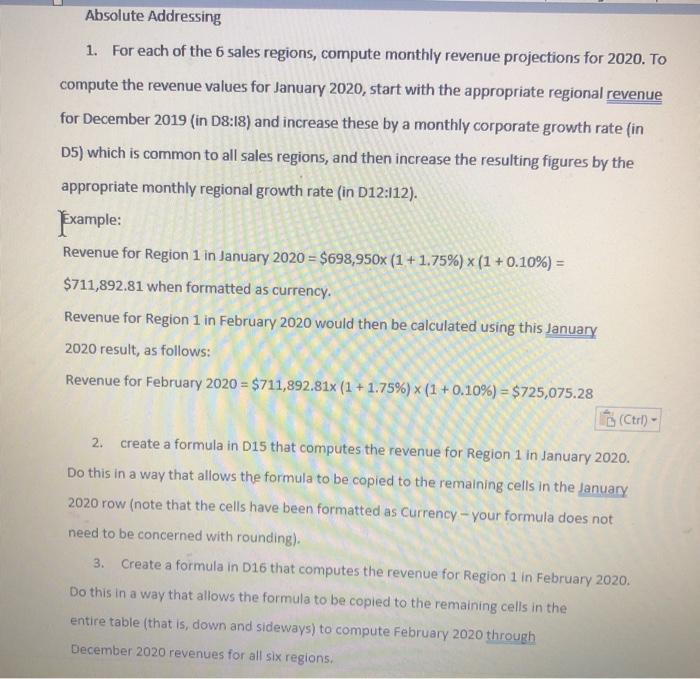
I neef help to solve this with explanation. D E Monthly Corporate Revenue Growth Rate in 2019 150% Region 1 $758,678 Region 2 $653847 Region

I neef help to solve this with explanation. image text in transcribed
image text in transcribed
D E Monthly Corporate Revenue Growth Rate in 2019 150% Region 1 $758,678 Region 2 $653847 Region 3 $748 592 Region 4 $725,467 Region 5 S253 647 Region 6 $645.374 Regional Revenue - December 2018 7 8 9 10 11 12 Region 1 0.10% Region 2 0.30% Region 3 0.54% Region 4 0.55% Region 5 0.23% Region 0.10 Monthly Regional Revenue Growth Rate in 2019 Region 1 Region 2 Region 3 Region 4 Region RORO 14 15 10 18 19 20 21 January 2019 February 2019 March 2019 April 2019 May 2019 June 2019 July 2019 August 2019 September 2019 October 2012 November 2019 December 2019 23 25 Absolute Addressing 1. For each of the 6 sales regions, compute monthly revenue projections for 2020. To compute the revenue values for January 2020, start with the appropriate regional revenue for December 2019 (in D8:18) and increase these by a monthly corporate growth rate (in D5) which is common to all sales regions, and then increase the resulting figures by the appropriate monthly regional growth rate (in D12:112). Example: Revenue for Region 1 in January 2020 = $698,950x (1 + 1.75%) x (1 + 0.10%) = $711,892.81 when formatted as currency. Revenue for Region 1 in February 2020 would then be calculated using this January 2020 result, as follows: Revenue for February 2020 = $711,892.81x (1 +1.75%) x (1 + 0.10%) = $725,075.28 (Ctrl) - 2. create a formula in D15 that computes the revenue for Region 1 in January 2020. Do this in a way that allows the formula to be copied to the remaining cells in the January 2020 row (note that the cells have been formatted as Currency - your formula does not need to be concerned with rounding). 3. Create a formula in D16 that computes the revenue for Region 1 in February 2020. Do this in a way that allows the formula to be copied to the remaining cells in the entire table (that is, down and sideways) to compute February 2020 through December 2020 revenues for all six regions

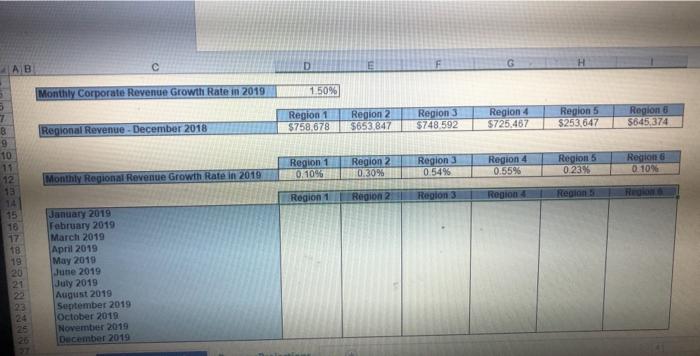
Step by Step Solution

There are 3 Steps involved in it

Step: 1

blur-text-image

Get Instant Access to Expert-Tailored Solutions

See step-by-step solutions with expert insights and AI powered tools for academic success

Step: 2

blur-text-image

Step: 3

blur-text-image

Ace Your Homework with AI

Get the answers you need in no time with our AI-driven, step-by-step assistance

Get Started

Recommended Textbook for

Data Access Patterns Database Interactions In Object Oriented Applications

Authors: Clifton Nock

1st Edition

0321555627, 978-0321555625

More Books

Students also viewed these Databases questions